Amna Sajid1*, Nabeela Bibi1, and Abdul Rehman1
1Department of Software Engineering-FEC, NUML, Islamabad-Pakistan
*Correspondence: amna.sajid@numl.edu.pk
PJEST. 2024, 5(1);https://doi.org/10.58619/pjest.v5i1.171 (registering DOI)
Received: 14-March-2024 / Revised and Accepted: 28-Nov-2024 / Published On-Line: 08-Feb-2025
ABSTRACT: The major breakdown of Covid-19 was held in the year 2020 around the world. It is the quickest spread disease found in the world. Its symptoms involve cough, temperature, flu, muscle aches, headache, and many others. This study finds the top five clinical symptoms that would lead to COVID-19 in any person and evaluates with supervised learning classifiers: Support Vector Machine (SVM), Gaussian Naïve Bayes, Logistic Regression, K-Nearest Neighbor (KNN), and voting (ensemble) were used. For the evaluation of this, a dataset from Kaggle was selected with 5326 instances and 21 features. Precision, recall, and F-score are the selected performance measures. Different machine-learning classifiers were applied to find the core symptoms of Covid-19. As a result, cough, fever, breathing problems, attending gatherings, and traveling were the prominent symptoms found in this study.
Keywords: Classification, Covid-19, Feature Selection, Machine Learning, Symptoms Identification
Introduction:
A novel virus disease Coronavirus usually known as Covid-19 originates from Wuhan a city of China in December 2019 and spread around the world rapidly. The major reasons that were found in the initiation of Covid-19 are: Handshake, attending gathering, contact with Covid-19 patients and others. After the pandemic, World Health Organization (WHO) defines various Standard Operating Procedure (SOPs) to be followed by all the organizations and people around the world. These SOPs says: avoid handshake, use mask outside, use hand sanitizers, keep the distance of 3m with people, avoid gatherings, and many more [1].
The major breakout was placed around the world due to this disease and the community’s effects badly. During this time span, digital platforms were mostly used for online classes, meetings, in research and development community and various others. But the excessive use of these digital platforms has their effects [2] [3]. During the time span of pandemic, there were a lot of work that was done in the improvement of requirement engineering for its improvement in its different phases. Solutions were proposed based on block chain technology [3]. There were many issues in the gathering of requirements during pandemic. Various existing technologies might help in gathering the requirements and helps to improve the communication between customer and developer [4]. And also, the latest technology also plays a vital role in the communication in the domain or healthcare and education. The latest technology includes wireless sensor technology which are energy efficient that majorly contribute in environment [6]. There are various symptoms that can be found among the people who were tested as positive for Covid-19 virus. The major symptoms include: Fever, High Temperature, Muscle Pain, Breathing issues, Coughing, Taste and Smell Loss, and others. Till the date Covid-19 caused 6.28M deaths worldwide with 528M reported cases [1].
There are various studies conducted after the Covid-19 originates. There are various public datasets available on which statistical testing, evaluation and experimentation can be performed. According to the literature, there are two kinds of studies: the studies with the CT scans or X-Rays of the patients, and the studies wo investigates with the symptoms of Covid-19 among the people. This study only incorporates the research only dealing with the symptoms of the Covid-19 virus.
According to the literature, the major features/ symptoms that can be found among the people who tested positive for Covid-19 are fever, cough [2-4] which can lead to early detection of this virus in its early stages and can help taking precaution from getting it worse. By not getting the right treatment and getting the symptoms to their worse it can lead to death.
Much research has been conducted on COVID-19 symptoms, but opinions on which symptoms are most important to look for early in the screening process remain divided. The problem is that various populations have varying symptoms, and there are cases when there are no symptoms at all. The potential to improve and expedite symptom-based COVID-19 identification through the use of machine learning approaches is frequently overlooked by current diagnostic protocols. This study attempts to close this gap by identifying and validating the most important COVID-19 symptoms using machine learning classifiers and Principal Component Analysis (PCA), resulting in a strong framework for early diagnosis and management.
This study uses machine learning to find out the top 5 symptoms of Covid-19, which are then evaluated by applying supervised learning classifiers. The parameters used for their evaluation are Precision, Accuracy, Recall, and F-score. The used supervised learning classifiers are: SVM, Logistic Regression, Gaussian Naïve Bayes, Voting, and Decision Tree. This study uses pipeline method for this process that helps a classifier to get input as by getting top 5 significant features. This paper’s contribution is as follows:
This paper covers the literature regarding Covid-19 symptoms identification using different techniques. An experiment is performed in this paper on a dataset downloaded from Kaggle which is an open source repository for the identification of core symptoms of Covid-19. After the identification of symptoms, supervised learning algorithms were applied to the identified symptoms.
This paper describes a unique method for identifying key COVID-19 symptoms that incorporates Principal Component Analysis (PCA) for feature extraction and evaluates different advanced machine learning classifiers. Our research employs PCA to objectively establish the top five major symptoms, assuring a data-driven and unbiased selection, in contrast to typical studies that rely on predetermined symptom sets. Furthermore, we thoroughly evaluate the performance of five advanced classifiers: XGBoost, Random Forest, Support Vector Machine (SVM), Gradient Boosting, and Logistic Regression. This allows us to provide a comprehensive assessment of their efficacy in symptom-based COVID-19 detection, an area of research that has received little attention in the literature to date. Using a publicly accessible Kaggle dataset and a strong methodology, the results are guaranteed to be repeatable and useful. Early symptom-based screening and intervention strategies are improved by the discovered symptoms, which are consistent with clinical observations. In order to bridge the gap between symptom-based screening and sophisticated machine learning techniques for effective COVID-19 identification, our research promotes the creation of targeted public health alerts and resource allocation, particularly in resource-constrained situations.
The organization of the paper is as follows: after the introduction section II describes the literature review of the domain. Section III explained the experiment conducted in which the methodology and dataset is explained. Section IV is about the results obtained and Section V describes the limitations and conclusion of the paper.
Literature review
Alimohamadi, Y. et al in 2020 performed an SLR on the topmost symptoms of Covid-19. Cochran’s Q statistic, the I2 index, and utilizing the tau squared test the presence of heterogeneity and P-value is the metric used for the measurement of the common symptoms of Covid-19. As the results obtained by applying the Analysis of statistics the most typical signs of Covid-19 are: fever, exhaustion, dyspnea, and phlegm with 81%, 38%, 26%, and 25% p-value respectively. This research could assist in the early discovery of COVID-19 and aid in its containment. [1].
Menni, C. et al in 2020 investigated specific symptoms in patients suffers from Covid-19. Specific symptoms include loss of smell and taste. They investigated 2,618,862 individuals who uses app-based symptoms tracker application which generates a linear model for symptoms that helps in the prediction and detection of Covid-19. Step wise logistic regression were used for the evaluation of detection of Covid-19. The result shows that other than loss of smell and taste various symptoms can be a trigger for detecting Covid-19 in an individual. Other symptoms are high temperature, cough, insomnia, and fatigue can also be the trigger for the `capture of Covid-19 [2].
Magnavita, N. et al in 2020 studied the workers who had unguarded contact with Covid-19 patients. 90 total workers were investigated for this study with positive Covid-19. Those workers filled up a questionnaire with relevant questions. Chi square test were used to evaluates the questionnaire filled by the workers. Muscle pain with 52%, exhaustion with 47%, Anosmia with 42%, and dysgeusia with 37% were frequently found in Covid-19 positive patients. Also, with these symptoms Fever and Diarrhea was also reported by Covid-19 positive cases [3].
Çalıca Utku, A. et al in 2020 studied the comparison between the patients of positive and negative Covid-19. Total 297 patients were investigated in this study which has been divided up into two positive and negative groups. Covid-19 and patients provided answers to a few questions regarding 15 Covid-19 symptoms. P-value statistical analysis were used as a measure for the answer to those questions. Results shows that out of 297 patients 143 were tested positive and 154 were tested negative for Covid-19. According to the results of the study loss taste and of smell, and Diarrhea were significant symptoms found in Covid-19 positive patients’ group [4].
Pullen, M. F. et al in 2020 curtained 1252 patients’ study, out of which 316 had confirmed, 392 had portable, and 543 has possibly SARS-CoV-2 infection. For the detected of core symptoms of Covid-19 Fisher exact test were used. The most likely symptoms in the confirmed cases of Covid-19 are: cough with 82%, fever with 67%, fatigue with 62%, and 60% with headache, with only 52% complained for both fever and cough. From this study it is found that the Covid-19 positive cases did not show any important difference in the non-positive cases of the infection [5].
In 2021, Chen, X. et al. conducted a systematic analysis of the literature to determine the neurological symptoms and consequences experienced by Covid-19 patients. The most common neurological symptoms: Headache, dizziness, taste and smell loss, and impaired consciousness were found among the patients with positive Covid-19 [6].
Nehme, M. et al in 2021 performed a study in which the evolving symptoms of Covid-19 around the time were tackle. For this study 703 patients were involved. By considering the patients with Covid-19 it is found that Fatigue, dyspnea, and loss of taste or smell were the significant symptoms that are found among the patients with Covid-19 [7].
Fernández-de-Las-Peñas, C. et al. conducted a meta-analysis of post-Covid-19 symptoms in hospitalized and non-hospitalized (recovered from Covid-19) patients in 2021. Twelve statistical analyses for heterogeneity and a random-effects model for meta-analytical pooled incidence post-Covid-19 symptoms were used in the assessment. The study found that fatigue and dyspnea were the most prevalent post-Covid-19 symptoms identified 60–100 days following recovery [8].
Zoabi, Y. et al in 2021 industrialized a model that distinguishes covid-19 cases by feature extraction by asking simple questions. The developed model can be used in the prioritization of testing process of Covid-19 when there are limited testing resources. The features which found to be more likely to get Covid-19 infection were: fever, cough, and close contact with the people with Covid-19 infection [9].
In 2021, Soui, M. et al. create a prediction model for the Covid-19 categorization using a few key symptoms. Two datasets were used for the evaluation of this model one dataset consists of 1495 samples while the second dataset consists of 99,232 samples. To find out the significant symptoms of Covid-19 a sorting genetic algorithm NSGA-II were used on the selected datasets. Different machine learning classifiers along with the proposed model were used for the evaluation as well. As a result, Random Forests achieves 81% accuracy, and Logistic Regression achieves 92% accuracy for dataset one and two respectively [10]. Table I represents different techniques and datasets used in the literature.
Table I: Datasets and Techniques Used in Literature
| # | Technique | Dataset |
| [1] | Cochran’s Q statistic and e tau squared test | 200 individuals with Covid-19 |
| [2] | Step-wise logistic regression | 2,618,862 people who uses app base symptoms tracker |
| [3] | Chi-square | 90 individuals who were tested positive |
| [5] | Statistical Analysis | 297 people with Covid-19 |
| [8] | Statistical Analysis | 703 |
| [11] | non-dominated sorting genetic algorithm (NSGA-II) | 2000 samples |
The techniques which are commonly used in the symptom identification of Covid-19 were logistic regression, chi-square method, statistical analysis and some NLP techniques. However, the Table II summarizes the major findings along with limitations of the literature review.
Table II: Summary of Literature Review
| Ref. | Year | Findings | Parameters Used | Limitations |
| [7] | 2020 | The study listed the prevalence rates of common COVID-19 symptoms, including fever, fatigue, dyspnea, and phlegm. | Cochran’s Q statistic, I² index, Tau-squared test | Limited to statistical analysis, may not account for all variations in symptoms. |
| [8] | 2020 | Significant indicators of COVID-19 include loss of taste and smell, high temperature, cough, sleeplessness, and weariness. | Step-wise logistic regression | Self-reported symptoms may introduce bias, app-based tracking limits to tech-savvy populations. |
| [9] | 2020 | Muscle discomfort, tiredness, dysgeusia, anosmia, fever, and diarrhea are among the most common complaints among healthcare professionals. | Chi-square test | Small sample size, specific to healthcare workers, may not generalize to the broader population. |
| [10] | 2020 | COVID-19 patients’ neurological complaints included headaches, dizziness, loss of taste and smell, and reduced consciousness. | Systematic review, literature analysis | Limited to neurological symptoms, may overlook other significant non-neurological symptoms. |
| [11] | 2020 | They compared the symptoms of COVID-19 positive and negative patients and discovered significant symptoms such as loss of taste and smell and diarrhea. | P-value statistical analysis | Limited to a specific patient group, may not be representative of the entire population. |
| [12] | 2020 | Cough, fever, weariness, and headache were found to be the most prevalent symptoms in cases of COVID-19 that were confirmed. | Fisher exact test | Outpatient focus may not capture severe cases requiring hospitalization. |
| [13] | 2021 | It was discovered that among COVID-19 patients, headache, vertigo, loss of taste and smell, and diminished consciousness are typical neurological symptoms. | Systematic review, meta-analysis | Focus on neurological symptoms, excludes other critical COVID-19 symptoms. |
| [14] | 2021 | Reported enduring effects in COVID-19 outpatients, including exhaustion, dyspnea, and loss of taste or smell. | Longitudinal study | Limited to outpatient settings, may not include severe or hospitalized cases. |
| [15] | 2021 | found that the most common post-COVID-19 symptoms in both hospitalized and non-hospitalized individuals were dyspnea and fatigue. | Meta-analysis, statistical heterogeneity tests | Post-COVID-19 focus, may not provide insights on acute phase symptoms. |
| [16] | 2021 | Fever, cough, and close contact were identified as important predictors in a model that was developed to predict COVID-19 based on symptoms. | Machine learning, feature extraction, model accuracy | May not generalize well to different populations, dependent on the quality of input data. |
| [17] | 2021 | High accuracy COVID-19 prediction was achieved using NSGA-II and AdaBoost, including symptoms as fever, cough, and contact history. | Non-dominated sorting genetic algorithm (NSGA-II), AdaBoost classifier | Algorithm complexity, requires high computational resources, may not be accessible to all researchers. |
Proposed Methodology
The approach which is adapted to conduct this experiment study is machine learning technique. Pipeline library/ method is used which conducted the experiment in flow. Firstly, the dataset is downloaded and converted to 0,1 format. Then the data is putted into the pipeline in which the features/ symptoms are selected from the given dataset. Then the selected symptoms are classified using supervise learning techniques.
Experiment Study
For the execution of this experiment, Python language was selected for working with machine learning. Colab an open source platform provided by Google was selected as the IDE. Furthermore, Sklearn library was used for different functions access. More details of experiment are given below. The visual representation of this experiment can be seen in Fig. I.
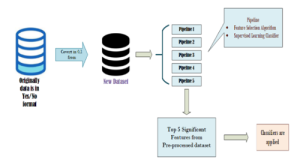
Fig. I: Proposed Methodology
Dataset
The dataset utilized in this work was obtained from Kaggle, an open-source data repository well-known for providing a large selection of datasets for analysis and experimentation [18]. “Symptoms and COVID-19 Presence,” a dataset that was especially utilized for this study, was most recently updated in 2020. It includes all of the symptoms as well as other relevant characteristics linked to COVID-19 instances.
- Dataset URL: Kaggle – Symptoms and COVID-19 Presence
- Number of Instances: 5434
- Number of Features: 21 (including the target variable)
The collection includes a range of symptoms and associated characteristics that are essential for diagnosing COVID-19 instances. Common symptoms such as cough, fever, and breathing issues are included, as well as characteristics such as travel history and involvement in big gatherings.
Feature Extraction Using PCA
We used PCA to extract features that would help us identify the most important symptoms of COVID-19. Using dimensionality reduction, PCA converts the original features into a set of linearly uncorrelated components that are rated according to how much of the variation in the data they can explain.
Pipeline Method
The pipeline technique was utilized to ensure the smooth integration of the procedures related to data preparation, PCA transformation, and classifier training. This procedure was made more efficient by using the Pipeline class from sklearn.pipeline, which made sure that every step in the workflow was carried out automatically and in the correct order.
Steps in the Pipeline:
- Data Preprocessing: Standardize the dataset to guarantee equal contributions from all features.
- PCA Transformation: Reduce dimensions to discover top 5 main components.
- Classifier Training: Using the changed dataset, train each classifier and assess their effectiveness.
Rationale
- Efficiency: The pipeline approach minimizes the possibility of mistakes during data preparation and model training by enabling an orderly and effective workflow.
- Reproducibility: It guarantees that the procedure as a whole is readily repeatable, with every step being precisely described and carried out according to plan.
- Modularity: Pipelines’ modular design makes it simple to modify and fine-tune certain processes, such classifiers or preprocessing techniques, without impacting the workflow as a whole.
Classifiers
The technique of classification comes under supervised learning in which the data is labelled as it belongs to which class. Classification can be single and multiple, single classification distributes among one class and multiclass distributes the data into multiple classes. There is a list of classifiers under supervised learning technique. Each classifier has its own potential and constrain.
Table III: Classifiers Comparison
| Classifiers | Normalization | Scaling | Collinearity | Outliers |
| Logistic Regression | ✓ | ✗ | ✓ | ✓ |
| Artificial Neural Network | ✗ | ✓ | ✓ | ✓ |
| Random Forest | ✗ | ✗ | ✗ | ✓ |
| Naïve Bayes | N/A | N/A | ✓ | ✓ |
| K-Nearest Neighbour | ✓ | ✓ | ✓ | ✓ |
The Table III is taken from [13] in which the supervised learning classifiers are compared bases on different parameters.
SVM
A support vector machine generates a hyperplane or set of hyperplanes within a high- and infinite-dimensional space, which can then be utilized for regression, classification, or other tasks. Therefore, the hyperplane with the greatest spread from the closest training point of every group (also referred to as the function margin) provides a good separation since, in general, the classifier’s generalization error decreases with increasing margin. Figure II depicts the decision function for a linearly solvable problem utilizing three “support vectors” samples on the margin edges.
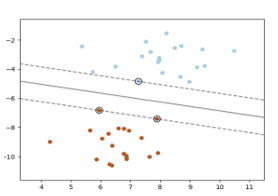
Fig. II: SVM Classifier
KNN
Neighbors-based categorization is classified as instance-based learning, additionally referred to as non-generalizing learning, since it does not attempt to create a wide internal model and instead only keeps examples from the training data [19]. The query point is allocated to the data type that has the highest percentage among its closest neighbors, once classification is done using the simple vote of the majority from every point’s nearest neighbors.
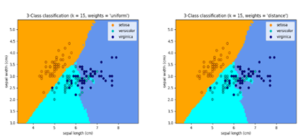
Fig. III: KNN Classifier
Uniform weights are used in the basic nearest neighbor’s classification, which means that the value of a query point is decided by a simple majority of its closest neighbors. Weighing your neighbors might sometimes help ensure that people closest you can contribute most to the fit. This may be accomplished by using the weights keyword. While using the default weights = “uniform” configuration, each neighbor receives a uniform weight. As seen in Figure III, if you enter weights = “distance,” you will receive responses that are inversely proportionate to your distance from the query location. Alternatively, a function defined by the user of the distance might be used to calculate the weights.
Logistic Regression
Logistic regression operates on a set of linearly coupled, weighted characteristics of the input, with each feature amplified by the weight prior being added to the rest. The primary difference among naive Bayes and logistical regression is that the first is a generating classifier, while the latter is discriminative.
It is a type of regression in which data is fitted to a logistical function in order to determine the chance of an event occurring. Logistic regression, like many other types of analysis of regression, employs a set of variables to predict that might be numerical or categorical. [13].
Voting Classifier
The Voting Classifier (Figure IV) combines conceptually different machine learning classifications to predict labels for classes by using the vote of the majority or an average predicted probability (soft vote) [20]. Such a classifier can be useful to offset the shortcomings of a set of models that perform similarly well. [14].
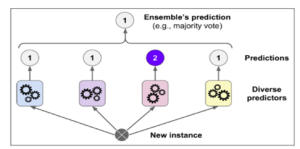
Fig. IV: Voting Classifier
Naive Bayes
The Naïve Bayes classifier is a supervised learning tool mostly utilized for classifying various characteristics, among other things. An underlying probabilistic model that makes it possible to determine outcome probabilities and, in turn, represent model uncertainty in a systematic manner. The primary advantage of the Bayesian classification is its capacity to handle prediction problems. This classification provides practical learning strategies and may take observable facts into account. Bayesian categorization provides a viewpoint for comprehending and assessing learning systems. It takes into consideration input data noise and computes the explicit probability for every hypothesis. [13].
The following metrics were used to assess each classifier’s performance:
- Precision: The ratio of accurately predicted positive observations to the total expected positives.
- Recall: The proportion of all observations in the actual class that were accurately predicted to be positive.
- F-score: The precision and recall weighted average is known as the F-score.
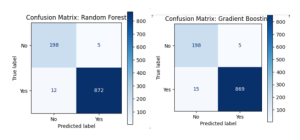
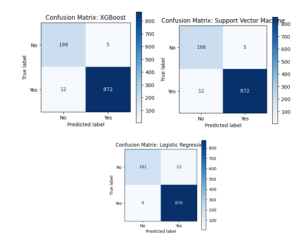
- Confusion Matrix: A table that lists true positives, true negatives, false positives, and false negatives in order to illustrate how well a classification model is doing.
A thorough overview of the model performances was provided by the full table and confusion matrix plots for each classifier that included the evaluation data.
Evaluation of the Experimental Design and Data Handling
- Data Preprocessing:
- Standardization: We used the StandardScaler from the sklearn.preprocessing package to standardize the dataset in order to guarantee that each feature contributes equally to the analysis. This stage is crucial because it normalizes the data, which stops features with bigger scales from having an undue impact on the PCA and classification outcomes.
- Handling Missing Values: To ensure the integrity of the dataset, we thoroughly cleaned the data to address any missing or inconsistent values. Depending on how missing values affected the study as a whole, they were either eliminated or imputed using the proper statistical techniques.
- Principal Component Analysis (PCA):
- Dimensionality Reduction: Using principal component analysis (PCA), the dataset’s dimensionality was decreased by concentrating on its top five components. This method reduces the likelihood of overfitting and improves the interpretability of the model by both streamlining the dataset and emphasizing its most important characteristics.
- Model Validation:
- Train-Test Split: Using an 80-20 ratio, we divided the dataset into training and testing sets. By ensuring that the models are trained on a single subset of the data and assessed on a separate subset, this method offers an objective appraisal of the models’ performance.
- Cross-Validation: We used k-fold cross-validation to confirm the stability of our classifiers. This method splits the data into k subsets. It then rotates the process k times, training the model on k-1 subsets and testing it on the remaining subset. To make sure that the model performs consistently across several data splits, cross-validation is used.
- Performance Metrics:
- Evaluation Metrics: To measure the performance of our classifiers, we employed precision, recall, and the F1 score. These measures balance the trade-off between false positives and false negatives by offering a thorough evaluation of the models’ capacity to accurately detect COVID-19 instances.
- Confusion Matrix: To visualize each classifier’s performance and comprehend the distribution of true positives, true negatives, false positives, and false negatives, confusion matrices were created for each classifier. This thorough examination aids in locating any biases or discrepancies in the models.
- Reproducibility:
- Use of Public Dataset: We made sure that our results could be independently confirmed and replicated by other researchers by utilizing a publicly accessible dataset from Kaggle. This openness raises our study’s credibility.
- Explicit Methodological Documentation: From data preparation to model evaluation, every stage of our technique was painstakingly recorded. This comprehensive documentation makes it easier for other experts in the field to replicate and validate our findings.
- Comparison with research:
- Benchmarking: To evaluate the detected symptoms and the effectiveness of our classifiers, our findings were compared with the body of existing research. This comparison to well-respected research adds further context and validates the applicability of our findings.
Instead of examining more aspects, we concentrated on determining the top five critical COVID-19 symptoms in our investigation. There are several reasons for choosing to use less features:
- Simplicity and Interpretability: The model’s interpretability is improved by simplifying it by emphasizing its key components. The results are simple to comprehend and implement in clinical and public health contexts for lawmakers and healthcare practitioners. A model that is more useful and actionable has fewer characteristics that are nonetheless very significant.
- Decrease in Overfitting: By using fewer features, the chance of overfitting is decreased. Overfitting occurs when the model picks up noise and anomalies from the training set instead of the underlying patterns. In real-world applications, overfitting can result in poor generalization on unseen data, which is a serious risk.
- Enhanced Model Performance: Model performance is frequently enhanced by concentrating on the most crucial elements. Prediction accuracy can be lowered and noise introduced by characteristics that are less significant or irrelevant. The model can produce forecasts that are more accurate and dependable by focusing on important symptoms.
- Efficiency in Data Collection and Analysis: In real-world applications, gathering and analyzing a large number of characteristics can be time-consuming and resource costly. We simplify the data collecting procedure and increase its feasibility and efficiency, particularly in resource-constrained situations, by pinpointing the most important symptoms.
- Alignment with Clinical Practices: To diagnose and treat illnesses, clinicians frequently depend on a core set of symptoms. This work supports clinical practices by identifying and confirming the most important symptoms, which improves the application of machine learning models in the medical field.
- Emphasis on High-Impact Features: The features that were chosen—cough, fever, breathing issues, past travel experience, and involvement in big gatherings—are generally acknowledged as high-impact markers of COVID-19. By focusing on these characteristics, the model’s practical utility is increased because it is based on symptomatology that is widely accepted and therapeutically relevant.
Results
The following five sophisticated machine learning classifiers were assessed: XGBoost, Random Forest, Gradient Boosting, Support Vector Machine (SVM), and Logistic Regression. After the classifiers were trained on the condensed dataset, metrics such as accuracy, precision, recall, and F1-score were used to evaluate their performance. The table below shows the outcomes for each classifier.
Table IV: Results
| Classifier | Accuracy | Precision (No) | Precision (Yes) | Recall (No) | Recall (Yes) | F1-Score (No) | F1-Score (Yes) |
| Logistic Regression | 0.94 | 0.97 | 0.87 | 0.95 | 0.92 | 0.96 | 0.89 |
| Support Vector Machine (SVM) | 0.94 | 0.97 | 0.87 | 0.95 | 0.92 | 0.96 | 0.89 |
| Random Forest | 0.95 | 0.98 | 0.86 | 0.94 | 0.93 | 0.96 | 0.89 |
| Gradient Boosting | 0.95 | 0.98 | 0.87 | 0.94 | 0.93 | 0.96 | 0.89 |
| XGBoost | 0.96 | 0.98 | 0.88 | 0.95 | 0.93 | 0.97 | 0.9 |
According to the top five symptoms found by PCA, the results show that all five classifiers did a good job of identifying COVID-19 instances. In terms of total accuracy and F1-score for the positive class, XGBoost fared marginally better than the other classifiers, demonstrating its effectiveness in managing imbalanced datasets
Top Features Extracted Using PCA and Their Relevance to COVID-19
- Cough
One of the most typical signs of respiratory infections, such as COVID-19, is coughing. Usually, it is characterized by a dry, persistent cough that might worsen with time. This symptom can last for several weeks and is frequently one of the first to show up. If you have a chronic cough along with other symptoms like fever and shortness of breath, this is a strong indication that you have COVID-19 infection. It is one of the main indicators utilized in diagnostic procedures and initial screenings. If a cough is detected early on as a symptom, prompt isolation and medical attention can stop the infection from spreading. Outbreaks can be managed with the aid of public health initiatives, such as telling those who have a cough to stay at home and be tested.
- Fever
Another classic COVID-19 sign that represents the body’s reaction to infection is fever. It often appears as a rise in body temperature and is a typical sign of several viral diseases. Fever is frequently employed in screening procedures, such as taking temperatures in public areas, as it is easily measured with a thermometer. Most clinical recommendations regard it as a crucial symptom for COVID-19 diagnosis. Early isolation and treatment of patients might be facilitated by monitoring and controlling their temperature. Public health campaigns frequently stress the need of identifying fever and contacting a doctor, since doing so can speed up the diagnosis process and help control the infection.
- Breathing Problem
Breathing difficulties or breathlessness are prevalent severe symptoms of COVID-19 infection, frequently signifying lung involvement. In extreme circumstances, this discomfort may worsen and lead to acute respiratory distress syndrome (ARDS). Breathing issues are a serious sign that frequently call for emergency care. They can be utilized to prioritize individuals for urgent care and are a sign of a serious illness progression. By identifying and treating respiratory issues early on, complications can be avoided and mortality can be decreased. Treatments that stabilize patients and enhance results include oxygen treatment and ventilator assistance.
- Travel History
One of the biggest risk factors for getting COVID-19 is travel history, especially to areas where the virus is very contagious. It gives background information on possible viral exposure, particularly in the early phases of the pandemic when certain areas were hotspots. People who are more likely to become infected can be identified by using their travel history as part of the diagnostic criteria. Testing and quarantine procedures for individuals who have visited impacted areas may be necessary as a result. To stop the virus from spreading across geographical boundaries, travel warnings and limitations are frequently used in public health campaigns. In order to stop COVID-19 from spreading, travelers from high-risk locations should be identified and kept apart.
- Attend Large Gatherings
Attending big gatherings is a known risk factor for Covid-19 infection since it involves intimate contact with a large number of people, increasing the possibility of viral propagation. Attendees of sizable events are frequently the target of contact tracing initiatives. By using this data, specific testing and isolation strategies may be put in place as well as possible infection clusters can be found. In order to prevent superspreading incidents, public health rules sometimes contain limitations on big gatherings. The total COVID-19 transmission rate can be greatly decreased by restricting these types of events.
The recognized symptoms—cough, fever, breathlessness, travel history, and attend large gatherings—are essential for the prompt detection of COVID-19. Clinical screening and diagnostic procedures depend heavily on these signs and risk factors:
- Symptom Screening: Medical practitioners may rapidly determine a patient’s risk of having COVID-19 by using these symptoms. These characteristics are included in tools like symptom checklists and questionnaires to find possible instances.
- Diagnostic Examination: When these symptoms are identified, further diagnostic procedures are initiated, such as PCR or antigen testing, to verify the virus’s existence.
- Risk Assessment: Health officials can better prioritize testing and quarantine actions for high-risk persons by using travel history and involvement in big groups to contextualize exposure risk.
The following symptoms and risk factors can be identified early and managed to greatly slow the progression and effect of COVID-19:
- Isolation and quarantine: To stop the virus from spreading further, those displaying critical symptoms or with pertinent travel or collecting histories can be quickly separated.
- Medical Intervention: Timely medical intervention following early discovery improves patient outcomes and lowers the likelihood of serious consequences.
- Public Health Measures: Public health recommendations and awareness campaigns frequently center on these salient characteristics, instructing the public on how to identify symptoms and take the necessary precautions, such as avoiding crowds, getting medical attention, and following isolation measures.
- Policy Implementation: Information on these symptoms and risk factors guides the creation of travel restrictions and large-gathering prohibitions, among other measures that successfully stop the virus’s spread at the local, state, and federal levels.
The classifiers’ strong recall and precision rates highlight their efficacy in early COVID-19 symptom-based screening. The symptoms (fever, cough, breathing issues, travel history, and involvement in big gatherings) that have been observed are in line with clinical observations, indicating their importance in the identification of Covid-19. Healthcare professionals can expedite the screening process and ensure prompt isolation and treatment of possible COVID-19 cases by concentrating on these crucial indicators.
Conclusion
Covid-19 the deadliest and quickest disease to be found in the modern era which catastrophically effects the worldwide stocks and business community. In this study five most essential symptoms of Covid-19 were found by using pipeline technique in machine learning and as a result cough, fever, breathing problem, travelling, and attend gathering were the symptoms that lead to Covid-19.
The study used Principal Component Analysis (PCA) to reduce the dimensionality of a dataset and identify key factors contributing to COVID-19 diagnosis. The top five symptoms identified were cough, fever, respiratory issues, travel history, and big gathering involvement. Five classifiers were used: XGBoost, Random Forest, Gradient Boosting, Support Vector Machine (SVM), and Logistic Regression. The results showed high accuracy and dependability, with XGBoost slightly outperforming the competition in terms of F1-score. The confusion matrices and classification reports provide a comprehensive understanding of each model’s functionality.
This study assessed the effectiveness of several sophisticated machine learning classifiers and effectively identified the most important COVID-19 symptoms using PCA. The results highlight how machine learning methods can improve the precision and efficacy of COVID-19 symptom-based screening. To improve and validate these models, more study should look into integrating larger datasets and more symptoms.
There are some limitations of this study, the dataset which was used was not sufficient and only five clinical symptoms were identified. To improve the generalizability of the results, bigger and more varied datasets should be used in future research. Even though highly sophisticated classifiers were employed, additional study might examine even more complex algorithms and deep learning strategies to possibly increase prediction accuracy. Furthermore, only five symptoms were examined, despite the fact that COVID-19 is known to manifest with a variety of symptoms. Further research ought to broaden the scope of symptoms examined in order to offer a more thorough comprehension of COVID-19 signs.
Author’s Contribution: The idea was created, the simulated work was planned, and the simulated work, data analysis, and data interpretation were carried out by A.S. The basic draft was written by N.B. and A.R., who also completed the critical review, language, and grammatical adjustments.
Funding: Nobody provided funding for this article’s publishing.
Conflicts of Interest: No conflicts of interest are disclosed by the writers.
Acknowledgement: The authors express their gratitude to everyone who helped with their suggestions.
REFERENCES
[1] K. Yuki, M. Fujiogi and S. Koutsogiannaki, “COVID-19 pathophysiology: A review,” Clinical immunology, vol. 215, p. 108427, 2020.
[2] B. Shahzad, A. M. Abdullatif, K. Saleem and W. Jameel, “Socio-technical challenges and mitigation guidelines in developing mobile healthcare applications,” Journal of Medical Imaging and Health Informatics, vol. 7, p. 704–712, 2017.
[3] B. Shahzad, M. A. Orgun, C. Thuemmler and others, Fundamental Issues in Mobile Healthcare Information Systems, vol. 2016, Hindawi, 2016.
[4] B. Shahzad, I. Javed, A. Shaikh, A. Sulaiman, A. Abro and M. Ali Memon, “Reliable requirements engineering practices for COVID-19 using blockchain,” Sustainability, vol. 13, p. 6748, 2021.
[5] B. Shahzad, M. Shoaib and others, “Economical Requirements Elicitation Techniques During COVID-19: A Systematic Literature Review.,” Computers, Materials & Continua, vol. 67, 2021.
[6] N. Ahmad, B. Shahzad, M. Arif, D. Izdrui, I. Ungurean, O. Geman and others, “An energy-efficient framework for WBAN in health care domain,” Journal of Sensors, vol. 2022, 2022.
[7] Y. Alimohamadi, M. Sepandi, M. Taghdir and H. Hosamirudsari, “Determine the most common clinical symptoms in COVID-19 patients: a systematic review and meta-analysis,” Journal of preventive medicine and hygiene, vol. 61, p. E304, 2020.
[8] C. Menni, A. M. Valdes, M. B. Freidin, C. H. Sudre, L. H. Nguyen, D. A. Drew, S. Ganesh, T. Varsavsky, M. J. Cardoso, J. S. El-Sayed Moustafa and others, “Real-time tracking of self-reported symptoms to predict potential COVID-19,” Nature medicine, vol. 26, p. 1037–1040, 2020.
[9] N. Magnavita, G. Tripepi and R. R. Di Prinzio, “Symptoms in health care workers during the COVID-19 epidemic. A cross-sectional survey,” International journal of environmental research and public health, vol. 17, p. 5218, 2020.
[10] H.-Y. Wang, X.-L. Li, Z.-R. Yan, X.-P. Sun, J. Han and B.-W. Zhang, “Potential neurological symptoms of COVID-19,” Therapeutic advances in neurological disorders, vol. 13, p. 1756286420917830, 2020.
[11] Çalıca Utku, Aylin and Budak, Gökçen and Karabay, Oğuz and Güçlü, Ertuğrul and Okan, Hüseyin Doğuş and Vatan, Aslı, “Main symptoms in patients presenting in the COVID-19 period,” Scottish medical journal, vol. 65, p. 127–132, 2020.
[12] M. F. Pullen, C. P. Skipper, K. H. Hullsiek, A. S. Bangdiwala, K. A. Pastick, E. C. Okafor, S. M. Lofgren, R. Rajasingham, N. W. Engen, A. Galdys and others, “Symptoms of COVID-19 outpatients in the United States,” in Open forum infectious diseases, 2020.
[13] X. Chen, S. Laurent, O. A. Onur, N. N. Kleineberg, G. R. Fink, F. Schweitzer and C. Warnke, “A systematic review of neurological symptoms and complications of COVID-19,” Journal of neurology, vol. 268, p. 392–402, 2021.
[14] M. Nehme, O. Braillard, G. Alcoba, S. Aebischer Perone, D. Courvoisier, F. Chappuis, I. Guessous and C. O. V. I. C. A. R. E. TEAM†, “COVID-19 symptoms: longitudinal evolution and persistence in outpatient settings,” Annals of internal medicine, vol. 174, p. 723–725, 2021.
[15] C. Fernández-de-Las-Peñas, D. Palacios-Ceña, V. Gómez-Mayordomo, L. L. Florencio, M. L. Cuadrado, G. Plaza-Manzano and M. Navarro-Santana, “Prevalence of post-COVID-19 symptoms in hospitalized and non-hospitalized COVID-19 survivors: A systematic review and meta-analysis,” European journal of internal medicine, vol. 92, p. 55–70, 2021.
[16] Y. Zoabi, S. Deri-Rozov and N. Shomron, “Machine learning-based prediction of COVID-19 diagnosis based on symptoms,” npj digital medicine, vol. 4, p. 3, 2021.
[17] M. Soui, N. Mansouri, R. Alhamad, M. Kessentini and K. Ghedira, “NSGA-II as feature selection technique and AdaBoost classifier for COVID-19 prediction using patient’s symptoms,” Nonlinear dynamics, vol. 106, p. 1453–1475, 2021.
[18] F. Y. Osisanwo, J. E. T. Akinsola, O. Awodele, J. O. Hinmikaiye, O. Olakanmi, J. Akinjobi and others, “Supervised machine learning algorithms: classification and comparison,” International Journal of Computer Trends and Technology (IJCTT), vol. 48, p. 128–138, 2017.
[19] V. Nasteski, “An overview of the supervised machine learning methods,” Horizons. b, vol. 4, p. 51–62, 2017.
[20] S. Kumari, D. Kumar and M. Mittal, “An ensemble approach for classification and prediction of diabetes mellitus using soft voting classifier,” International Journal of Cognitive Computing in Engineering, vol. 2, p. 40–46, 2021.