Daniel Yousaf,1* Riaz Ahmad1
1Department of Physics, Government College University, Lahore
*Corresponding Author: danielfccollege@gmail.com
PJEST. 2024, 5(1);https://doi.org/10.58619/pjest.v5i1.175 (registering DOI)
Received: 5-Oct-2024 / Revised and Accepted: 20-Jan-2025 / Published On-Line: 08-Feb-2025
ABSTRACT: Helium plasma has been widely used for the production of active species by mixing in other gases which are used for surface modification of metals. Helium plasma is generated using 100 Hz pulsed DC source and its characterization is carried out by using optical emission spectroscopy. The spectra of helium is recorded at filling pressure (0.5-3.0 mbar), source power (25-150 W) and inter-electrode distance (3-5 cm) using Ocean Optics HR 4000 spectrometer. It is found that production of active species of helium strongly depends on discharge parameters. Evolution of the selected emission intensities of He-I and He-II are presented in this paper. The emission intensities of He-I (501.3 nm and 667.7 nm) as a function of above parameters are used for the determination of electron temperature. The spectroscopic technique based on the measurement of relative intensities of two spectral lines of the same atom is used to evaluate the electron temperature, which is found to vary from 0.82 eV to 1.89 eV depending on the various discharge parameters.
- Introduction
Matter in the entire visible universe is plasma. Plasma is composed of a relatively large number of charged particles, which form a strong interacting system [1]. Plasmas are generally produced by electrical discharges in gases and usually excited and sustained by providing electrical energy in different forms like direct current, pulsed direct current, radio frequency, micro waves etc. Plasma can also be produced in liquids and solids by providing enough energy that can produce vaporization and ionization in the material. Although Plasma can be produced in many ways with different techniques but “Glow Discharge” is the most common. It is easier technique to produce Plasma in the laboratory environment [2]. In the glow discharge, excitation and ionization of the gas atoms takes place due to inelastic collision. The excitation collisions are responsible for the characteristics named as “Glow Discharge”. We use glow discharge method for the analysis of the elements especially solid materials using optical emission spectroscopy (OES) and mass spectrometry (MS) [3, 4]. The characteristic is very important for the analysis because higher instantaneous operation powers increase atomization, excitation and ionization [5, 6], without inducing an excessive heating of the sample or plasma instability. As excitation and ionization are highly nonlinear with field strength, Therefore, higher instantaneous sputtering, ionization, and excitation can be produced with better efficiency by pulse dc- discharge. The applications of pulse glow discharge are plasma nitriding of materials e.g. steel and deposition of hard coating. We can measure electron density and temperature of the glow discharged plasma. Kajita et al [7]. measured the electron density and temperature using the line intensity ratio method of He I (λ = 667.8, 706.5 and 728.1 nm) and are compared to the Langmuir probe method. It was found that the increase of the density in 3 1S state or decrease of the density in 3 3S was enhanced due to the injection of the molecules (hydrogen or deuterium) with the plasma. Jonkers et al [8]. measured an excitation temperature which was widely used to characterize the plasmas. It was investigated that due to the specific atomic structure of helium only a limited amount of excited levels can be observed and more or less the same excitation temperature is found. Saba et al [9]. measured the plasma electron Temperature and density by using different applied voltage and working pressure in the magnetron sputtering system. Elghazaly et al [10]. described the fundamental plasma parameters obtained by cylindrical Langmuir probe within low-pressure electrical gas discharge plasma. Kohsiek et al [11].
- Experimental setup
Helium gas was utilized for plasma region. With 100 Hz pulsing DC- power in a parallel plate configuration of electrodes whose diameter is 9.5 cm and spacing in between them is 3.0 cm. These electrodes were arranged in a parallel plate configuration. Electrical power is applied to the top electrode through the inductive load, which limits the current during the discharge. Prior to admitting the helium gas, the chamber is evacuated. Optical emission spectroscopy is carried out using a computer-controlled system comprising an Ocean optics spectrometer model HR 4000. The system is calibrated using a He-Ar lamp. The emission spectra (300-900 nm) are recorded as a function of electrical power (25-150 watt), filling pressure (0.5-1.5 mbar) and inter-electrode spacing (3-5 cm). The emission spectra was recorded at a filling pressure 1 mbar, with power of 100 watt and 4 cm inter- electrode spacing. Two of the ports serve as view windows or optical windows. These view windows are used to monitor the status of the discharge whereas optical window allows transmission of the light emanating from the glow discharge source to the interior of the spectrometer for spectroscopic analysis. One of ports is closed with the steel disc of thickness 1 cm having three small holes in vertical lines each of 1 cm diameter.
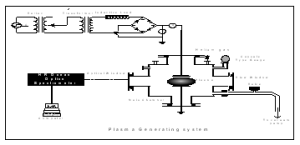
Fig. I: Schematic Diagram of Plasma Chamber
- Results and discussions
3.1 Role of power source on the active species of helium
From the experimental results, it is observed that when we increase the power supplied to the electrodes, the intensity emission increases. This increase in intensity is due to the fact that when power given to the electrodes increased, electrons and ions are attracted toward their respective electrodes more rapidly. Due to the high electric field, electrons gain more energy and make inelastic collision with the gas atoms. Due to their inelastic collision, the excitation and ionization of the helium atoms take place, which causes the increase in the intensity of the active species of the gas [12].
As a result of ionization process, ions that are accelerated due to the stronger electric field strikes the cathode with sufficient energy to cause the emission of the secondary electrons from it, which are also responsible for more excitation and ionization and as a result there is an increase in intensity of the species [12]. If we change power ranging from 10 watt up to 40 watt, we found that there is a change in intensity whose value varies from 10 to 60 a.u for the wavelength of 447.2, 501.28 & 728.23 nm with distance of 4.0 cm between the electrodes.
Table I: Comparison of peak intensities of Helium gas for various powers
| Power (watt) | 10 | 20 | 30 | 40 |
| Intensity (a.u) for
λ = 728.2 nm |
10 | 20 | 30 | 60 |
| Intensity (a.u) for
λ = 501.2 nm |
20 | 28 | 45 | 80 |
| Intensity (a.u) for
λ = 447.2 nm |
6 | 11 | 20 | 50 |
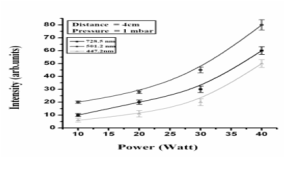
Fig. II: Graph between power (watt) and intensity (a.u) for wavelength 501.28 nm, 447.2 nm and 728.23 nm.
3.2 Dependence of active species of helium on pressure
Pressure of the gas plays very important role for the active species of helium plasma because when pressure of the gas is increased, collisions of electrons with the neutral atoms of the gas increases and as a result, discharge current increases and voltage decreases if power and distance between the electrodes are kept constant [13]. The graph given below shows the effect of filling pressure on the emission intensity of the selected lines of the helium species. At low pressure of about 0.5 mbar free electrons gain enough energy by the electric field because of the low density of the helium gas, mean free path for the electrons is large. With the increase of the pressure, mean free path and energy of the electrons decreases and as the mean free path for the electrons is not large enough to excite helium atoms and most of the electrons may not get enough energy, thereby, resulting in decrease in emission intensity [14]. The intensity of the emission
lines of the excited atoms decreases more rapidly for the line 728.23 nm comparative to the line 501.28 nm because of its greater excitation energy. We consider the pressure of the gas starting from range 0.5 mbar to the pressure up to the range 3.0 m bar and we concluded that with the increase of the pressure of the gas, the intensity of the helium species decreases. We have drawn graph for the wavelengths of 728.23, 501.28 nm and 447.5 nm with the distance between the electrodes is 4.0 cm as shown in Fig. 3.2
Table II: Comparison of peak intensities of Helium gas for various pressure
| Pressure (m bar) | 11 | 11.5 | 22 | 33 |
| Intensity (a.u) for
λ = 501.2 nm |
330 | 228 | 224 | 118 |
| Intensity (a.u) for
λ = 447.2 nm |
114 | 113 | 112 | 99 |
| Intensity (a.u) for
λ = 728.5 nm |
113 | 112 | 110 | 77 |
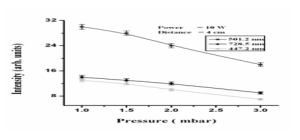
Fig. III: Graph between pressure of the gas and intensity of the active species, for the wavelength of 447.2, 501.2 and 728.5 nm.
3.3 Dependence of the active species of the helium gas on inter- Electrode distance
The reason is this, that by increasing distance between the electrodes, electric field decreases and hence power to attract the electrons and ions toward their respective electrodes also decreases. Energy gained by the electrons and ions due to less electric field also decreased.
Therefore, a very small number of ions will reach at the cathode to produce secondary and energetic electrons, which cause the excitation and ionization of the helium gas. In this way the process of ionization and excitation decreases and hence intensity of the active species of the helium decreases. Here in the graph given below in Fig. 3.3 we observe that by increasing the distance from 3.0 cm to 5.0 cm between the electrodes, for the wavelengths of 728.5, 501.2 and 447.2 nm, the emission intensity of the atoms of the gas decreases. Therefore, from the graph, it is clear that the intensity of the electron decreases with the increase of distance between the electrodes.
Table III: Comparison of peak intensities of Helium gas for various distances
| Distance (cm) | 3.00 | 4.00 | 5.00 |
| Intensity (a.u) for
λ = 728.5 nm |
13 | 10 | 7 |
| Intensity (a.u) for
λ = 501.2 nm |
30 | 27 | 24 |
| Intensity (a.u) for
λ = 447.2 nm |
16 | 14 | 11 |
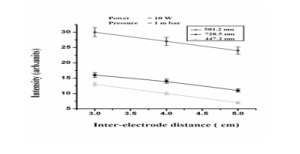
Fig. IV: Graph between distance and intensity (a.u) for the wavelengths of 447.2, 501.2, 728.5 nm
- Plasma electron temperature
In optical emission spectroscopy, we need to determine the electron temperature and density in plasma in order to understand the features of atoms and molecules. During this process, a small fraction of these species are promoted to an upper electronic state through electron impact excitation. These species then decay and emit a photon with a specific wavelength, which may be detected and evaluated by recording the emission spectrum. The fundamental principle of this approach is that the emission intensity of a specific wavelength from an excited state is directly related to the concentration of species in that excited state. The relative intensities of this emission provide information on the concentration of the species. The Coronal model can be used for optical emission in low electron density plasma (ne<1011 cm-3). [15, 16]. As a result, in this scenario, species are activated only by the impact of electrons and decay radioactively rather than colliding with electrons. The ratio of these emission lines is thus temperature dependent for electrons. This formula gives the intensity ratio of two lines that belong to the same atomic species and have a shared lower state.[17].
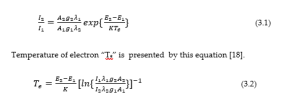
Here we give explanation about the electron temperature with different parameters like, with different pressure, powers and distances. We draw graph between different pressure and electron temperature to see the effect of pressure on electron temperature. Graph has been drawn for the wavelength of λ=728.5, 501.2 and 447.2 nm with the distance of 4 cm between the electrodes starting from pressure of 1.0 mbar up to 3.0 mbar. The graph is given below.
3.5 Dependence of plasma electron temperature on pressure of the gas
Table. IV: Comparison of Electron Temperature of He for various pressure
| Pressure (m bar) | 11.00 | 11.50 | 22.00 | 22.50 | 33.00 |
| Electron Temp. (k) for λ = 728.5 nm | 11.70 | 11.25 | 11.16 | 11.0 | 0.8 |
| Electron Temp. (k) for
λ = 447.2 nm |
11.75 | 11.40 | 11.20 | 11.12 | 0.9 |
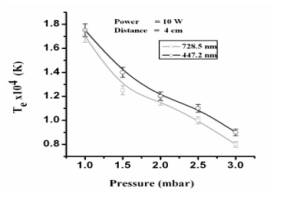
Fig. V: Graph between pressure and electron temperature at power 10 W.
Fig.3.4 shows the variation of the electron temperature with change in pressure from 1.0 mbar to 3.0 mbar in the plasma chamber. Now, we will give explanation for decreasing of the electron temperature of the helium gas by increasing the pressure of the gas. The fact is this that when we increase the pressure of the gas then the collision between the neutral atoms of the gas and electrons increases and as a result the temperature of the electrons decreases because due to the more collisions some of the energy of the electrons utilizes by colliding with the atoms and molecules of the gas. Hence with the increase of the pressure the electron temperature decreases.)
3.6 Dependence of plasma electron temperature on power supplied.
Plasma electron temperature as a function of discharge parameter can be described by considering power (10—40 watt) and filling pressure is 1 mbar then from the graph as shown in the Fig.3.6 We can see the dependence of the electron temperature on input power. When we increase the power, excitation as well as ionization process occurs rapidly. As a result electrons and ions are produced. When the power between the electrodes is increased, then electric field between the electrodes also increases and due to increase of electric field the electrons and ions are attracted more rapidly toward electrodes and the ions strike the cathode speedily then energetic secondary electrons are produced. Hence due to the increase of power, electron temperature increased. In the graph we have considered wavelengths of 447.2, 501.2 and 727.5 nm which shows increase of electron temperature with the increase of power ranging from 10.0 Watt to 40.0 Watt.
Table V: Comparison of Electron Temperature of He for various powers
| Power (watt) | 110 | 220 | 330 | 440 |
| Electron Temperature (K) for λ = 501.2 nm | 0.82 | 11.43 | 11.73 | 22.5 |
| Electron Temperature (K)
for λ = 447.2 nm |
0.82 | 11.14 | 11.35 | 22.3 |
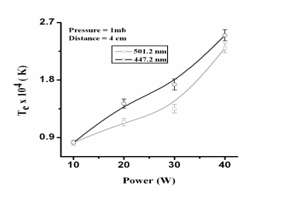
Fig. VI: Graph between power (W) and electron temperature (k)
- Conclusions
When pressure of the gas is increased, collisions of the electrons with the neutral atoms increase and dissociation of the atoms of the gas is also increased and as a result, the discharge current increases and voltage decreases if power and distance between the electrodes kept constant [19]. When pressure is low almost at 0.5 mbar, free electrons get enough energy by the electric field because of the low density of the helium gas. Mean free path and energy of the electrons decreases and as the mean free path for the electrons is not large enough to excite helium atoms and most of the electrons may not get enough energy. Thereby, resulting in decrease in emission intensity [20]. Similarly, when we increase the power supplied to the electrodes, the potential at the electrodes increases, due to which ions and electrons are attracted more rapidly toward their respective electrodes and make inelastic collision with the atoms of the gas, resulting in excitation, and ionization processes. This increases the intensity of the active species of the helium gas. As a result of ionization process, ions that are accelerated due to the stronger electric field strikes the cathode with sufficient energy to cause the emission of the secondary electrons from it which is also responsible for more excitation and ionization and as a result, there is an increase in intensity of the species [21]. If we increase the distance between the electrodes, the intensity of the active species decreases. This fact can be explained as kinetic energy gained by the electrons through electric field decreases with the increase of distance. Therefore, only a small number of ions will reach the cathode and create the secondary and energetic electrons which cause the decrease in excitation and ionization of the helium gas. So the intensity of the active species of helium decreases.
Plasma electron temperature is determined from relative intensities of two spectral lines of the same atomic species for the wavelengths of 501.3 nm and 667.7 nm which also shows its dependence on the pressure of the gas, power and inter electrode distance between them. By increasing the pressure, electron temperature decreases significantly because of energy transfer from the electron to neutral particles of the gas increases causing an increase in the temperature of the gas and decreases the electron temperature. Here, electron temperature decreases from 3 eV to 1 eV with the increase of the filling pressure (1-3 mbar) at input power of 30 watt by keeping the inter- electrode distance equal to 4.00 cm.
Similarly, electron temperature increases by increasing the power. It is due to increase of the excitation and ionization processes take place in the helium species. Due to bombardment of the ions on the cathode, secondary electrons are produced which increase the electron temperature. The electron temperature increases from .8 to 2 ev by increasing power source from (10- 40 watt) with filling pressure of 1 mbar and with 4.00 cm inter – electrode distance. Hence it is concluded that plasma discharge parameters can be used to optimize the generation of the active species of helium for material processing.
Author’s Contribution: The idea was created and the impact of electric power, gas pressure, and electrode distance on the active species was calculated by D.Y. Electron temperature and density of helium plasma was calculated by R. A and D.Y. Both authors completed the critical review, language and grammatical adjustments.
Funding: Nobody provided funding for this article’s publishing.
Conflicts of Interest: No conflicts of interest are disclosed by the writers.
Acknowledgement: The authors express their gratitude to everyone who helped with their suggestions.
References:
[1] A C Dass, Space Plasma Physics vol. 1: Narosa publishing house, 2004.
ISBN-13 : 978-8173195754
[2] Alfred Grill, Cold plasma in Material Fabrication. From fundamentals to applications vol. 1. New York: IEEE press,, 1994. ISBN-13: 978-0780347144
[3] M. B. J. W.Waggoner, K.L.Sutton, H.B.Fannin,. “Novel low power/reduced pressure inductively coupled plasma ionization source for mass spectrometric detection of organotin species,” Journal of Analytical Atomic Spectrometry, vol. 13, 1998. DOI:10.1039/A802222D
[4] S. S. J. Millman, . Electronics. New York: McGraw-Hill, 1951.
[5] S. D. Popa, “influence of pressure on spectral intensities in a flowing nitrogenglow discharge,” J. Applied Physics, vol. 29, 1996. DOI: https://doi.org/10.18816/r-bits.v5i2.7252
[6] A. Bogaerts, J. Anal. Atom. Spectrum vol. 14, 1994. DOI: 10.1039/A900772E
[7] S. Kajita; N. Ohno; S. Takamura; T. Nakano, “Comparison of He I line intensity ratio method and electrostatic probe for electron density and temperature measurements in NAGDIS-II,” PHYSICS OF PLASMAS, vol. 13, 2006. https://doi.org/10.1063/1.2164461
[8] M. V. M. J.Jonkers., “The Excitation Ttemperature In (He) Plasmas,,” J. Quantum Spectroscopy. Radioactive transfer, vol. 61, pp. 703-709, 1999. https://doi.org/10.1016/S0022-4073(98)00059-4
[9] M. R. K. S.N. Mazhar, . “Measurement of Plasma electronTemperature and density by using different applied voltage and working pressure in the magnetron sputtering system,” International Journal of Engineering and Technology, vol. 3, pp. 1177-1180, 2018.
[10] A. M. A. b. M.H. Elghazaly, M.M. Mansour, M. Gabr, N.M. Elsayed,. “Journal of quantitative spectroscopy & radiative transfer,” vol. 97, pp. 58-67, 2006. https://doi.org/10.1016/j.jqsrt.2004.12.029
[11] W. Kohsiek., “Measurement of the electron temperature and density of a helium plasma produced by a hollow cathode arc discharge.,” vol. 17, 2002. DOI 10.1088/0032-1028/17/12/007
[12] A. Q. M. A. Naveed, S. Ali, M. Zakaullah, Effects of helium gas mixing on the production of active species in nitrogen plasma, Physics Letters A, vol. 359, pp. 499-503, 2006. https://doi.org/10.1016/j.physleta.2006.07.002
[13] T. N. A. Bengtson, “The concept of constant emission yield in GDOES,” Anal Bioanal Chem, vol. 385, pp. 568-585, 2006. DOI 10.1007/s00216-006-0412-7
[14] O. A. T. Kikuchi, M. Wada, T. Ohachi, , “Role of excited nitrogen species in the growth of GaN by RF–MBE,” Journal of crystal Growth vol. 292, pp. 221-226, 2006. doi:10.1016/j.jcrysgro.2006.04.019
[15] V. M. Donnelly, “Measurements of plasma electron temperature and electron energy distributions by trace rare gases optical emission spectroscopy,,” J. Phys. D: Appl. Phys, vol. 37, 2004. DOI: 10.1080/10519990601125151
[16] E. E. S. R. F. Boivin, “Electron temperature measurement by a helium line intensity ratio method in helicon plasmas.,” J. Plasma Physics, vol. 12, pp. 5303 – 5314, 2001. https://doi.org/10.1063/1.1418020
[17] D. S. H. N. N. Sesi, P. Galley, J. Homer, M. Huang, G.M. Hieftje, , “An imaging based instrument for fundamental plasma studies,,” J. spectrochim. Acta, vol. 52, 1997. https://doi.org/10.1016/S0584-8547(96)01562-5
[18] W. L. Holtgreven, Plasma Diagnostics. New York: John Wiley & Sons,, 1968. ISBN-13 : 978-0720401370
[19] T. N. A. Bengtson., “The concept of constant emission yield in GDOES,” Analysis of Bioannual Chem, vol. 385, pp. 568- 585, 2006. DOI: 10.1007/s00216-006-0412-7
[20] M. W. T. Kikuchi., T. Ohachi,, “Role of excited nitrogen species in the growth of GaN by RF–MBE,” Journal of Crystal growth, vol. 292, pp. 221-226, 2006. doi:10.1016/j.jcrysgro.2006.04.019
[21] A. Q. M.A.Naveed., S. Ali,, “Effects of helium gas mixing on the production of active species in nitrogen plasma,” J. Physics Letters, vol. 359, pp. 499-503, 2006. https://doi.org/10.1016/j.physleta.2006.07.002