Jahangeer shah1, Junaid Babar1, Haroon Al Rasheed1, Muhammad Khalid2
1 University of Balochistan, Quetta, Pakistan
2HITEC University, Taxila, Pakistan
PJEST. 2023, 4(4); https://doi.org/10.58619/pjest.v4i4.153 (registering DOI)
Received: 28-Oct-2023 / Revised and Accepted: 27-Dec-2023 / Published On-Line: 30-Dec-2023
ABSTRACT: This study uses Autoregressive Integrated Moving Average (ARIMA) and Artificial Neural Networks to predict COVID-19 in Pakistan. The pandemic epidemic that hit Wuhan, China, in December 2019 and affected millions of people worldwide. As of March 1, 2023, Pakistan had 296,149 confirmed cases, 6,298 deaths, and 280,970 recoveries. The predictive algorithms above will predict confirmed cases, deaths, and recoveries for 30 days. The approach collects time-series data on confirmed cases, deaths, and recoveries. The data is processed and analyzed using ARIMA and ANN models. These models were chosen because they can handle non-linear and complex time series data, making them excellent for pandemic prediction. The research hypothesis is that ARIMA and ANN models can accurately anticipate Pakistani COVID-19 case trends over the next 30 days. Correlation and MSE are used to compare models. Early results reveal that ARIMA and ANN models accurately estimate COVID-19 prevalence in Pakistan. An in-depth study of the methodology suggests adjustments to improve forecast accuracy. This study has significant ramifications. Accurate projections can help policymakers choose public health initiatives, saving lives and money. Successfully using these machine learning models could lead to their usage in epidemic prediction.
Keywords: COVID-19, ARIMA, ANN, Machine Learning, Pakistan, Covid-19 Prediction, Public Health
Introduction:
The worldwide medical emergency known as the COVID-19 pandemic has arisen due to the advent of a previously unidentified coronavirus, SARS-CoV-2. The rapid transmission of the virus across multiple countries in Europe, North America, and the Asia-Pacific region led to the declaration of a global pandemic by the World Health Organization (WHO) on March 11, 2020 [1, 4]. This phenomenon arose due to the swift dissemination of the virus. According to the World Health Organization (WHO), on March 13, 2020, it was announced that Europe had emerged as the primary focal point of the ongoing epidemic [1]. The most affected countries include Italy, the United States, India, Iran, China, Spain, and Russia. As of March 1, 2023, the total number of confirmed COVID-19 cases globally was over 440 million, with more than 5.8 million deaths and over 390 million recovered cases. The pandemic has led to extreme social, psychological, and economic consequences, disrupting daily life and posing significant challenges to healthcare systems and economies in all affected countries. The virus exhibits a high level of infectivity. It can potentially induce several symptoms, including fever, respiratory distress, coughing, and the development of invasive lesions in the lungs of affected individuals [1, 3].
The COVID-19 pandemic has substantially impacted Pakistan, resulting in many confirmed cases and Deaths [6, 7]. The initial documented case of COVID-19 in Pakistan was officially recorded on February 26, 2020, with the first fatality attributed to the virus occurring on March 18, 2020. According to the latest available data as of March 1, 2023, Pakistan has reported a cumulative total of 296,149 confirmed cases. Among these instances, 6,298 deaths and 280,970 individuals have successfully recovered from the illness [5]. The global epidemic has resulted in a significant burden on a global scale, with Pakistan being no exception [7]. The Pakistani government has implemented many measures to mitigate an outbreak within the country, yet the current circumstances continue to present significant challenges
The COVID-19 pandemic has significantly impacted Pakistan, as indicated by the number of confirmed cases in the millions and reported deaths in the thousands
[9, 12]. The confirmation of the virus’s arrival in Pakistan occurred on February 26, 2020, with the recording of two instances [14]. Following the outbreak, the Pakistani government has implemented various measures to mitigate its occurrence. Additionally, efforts have been made to introduce face detection [11, 31] technologies to minimize human participation in official settings. However, despite these efforts, the current circumstances continue to present significant challenges [9, 12, 14]. COVID-19 studies have garnered significant interest within the Pakistani environment. Numerous scholarly investigations have been conducted on the medical dimensions of COVID-19, as evidenced by the existing literature [6, 10, 14]. Conversely, researchers have conducted sociological [13] , economic [10, 14], and statistical analyses of COVID-19 in numerous studies.
The primary emphasis of statistical research typically lies in predicting the pandemic at a national level. In addition to numerous other nations, Pakistan has also been investigated in several studies [9]. A diverse range of statistical and predictive studies employ many research methodologies, including time-series analyses, data mining techniques, growth models, nonlinear regression analysis, epidemiological models, and artificial intelligence (AI) research methodologies. Within the context of the COVID-19 forecasting project, the ARIMA model has received significant attention as a time-series-based methodology with notable efficacy. The ARIMA model, a statistical technique, has been widely employed in many countries’ academic literature on COVID-19 [9] . Moreover, artificial neural networks (ANN) have been employed in numerous research to forecast the incidence of COVID-19 and have been consistently demonstrated as an effective technique for prevalence prediction [12, 43]
The primary objective of this study is to analyze the patterns and trends of COVID-19 incidence in Pakistan. The management of infected patients, deaths, and recoveries will be addressed, and predictive models will be constructed utilizing the ARIMA and ANN methodologies. The research will employ a technique that encompasses data collecting, the utilization of ARIMA and ANN models, and assessment and validation procedures. The anticipated results of this study encompass precise and punctual forecasts regarding the dissemination of COVID-19 in Pakistan, identification of the pivotal factors that contribute to the transmission of COVID-19 in Pakistan, enhanced comprehension of the dynamics associated with COVID-19 in Pakistan, and the establishment of a predictive model that can be employed for future COVID-19 prognostication in Pakistan.
Literature Review
The emergence of a novel coronavirus, scientifically referred to as COVID-19, has garnered significant interest among global scientific communities, particularly those engaged in epidemiology. Precisely forecasting infectious diseases, such as the trajectory of COVID-19, is essential in executing public health interventions and devising appropriate intervention strategies efficiently. In pursuing this objective, applying machine learning methodologies such as ARIMA (AutoRegressive Integrated Moving Average) and ANN (Artificial Neural Networks) has emerged as noteworthy instruments. The use of this application in forecasting the trajectory of COVID-19 in Pakistan has garnered significant attention, with several studies emphasizing its efficacy [15-18].
ARIMA models are widely recognized in time series forecasting and have been extensively employed in predicting epidemiological patterns. Khan et al. (2020) demonstrated the utility of ARIMA models in accurately forecasting short-term COVID-19 cases in India [15]. Ahmed and Malik (2020) conducted a comprehensive evaluation of the efficacy of ARIMA. Their findings indicate that ARIMA effectively captured both the trend and seasonality patterns in the COVID-19 data, facilitating accurate forecasts about the incidence of cases and fatalities in Pakistan [16].
Research has shown that artificial neural networks (ANN) can predict intricate nonlinear patterns effectively. This capability is derived from the inspiration drawn from biological neural networks’ structural and functional characteristics. In their study, Baker et al. (2021) employed artificial neural networks (ANN) to predict the number of COVID-19 cases in Pakistan. Their findings indicate that ANN outperforms conventional statistical methods regarding prediction accuracy [17]. Additionally, Iqbal et al. (2020) emphasized the potential utility of deep learning, a subset of ANN, in forecasting the spread of the virus within Pakistan [18].
Comparison studies have been conducted to examine the performance of ARIMA and ANN models in predicting COVID-19 trends. Ali et al. (2021) found that ANN had more excellent performance in capturing nonlinear patterns, contrasting with the more suitable application of ARIMA for linear data [19]. The conclusion above was corroborated by Hussain et al. (2020), who conducted a study and found that artificial neural networks (ANN) exhibit more excellent reliability in handling the inherent unpredictability of pandemic-related data [20].
Hybrid models have been developed by researchers who have carefully considered the advantages and disadvantages of both Autoregressive Integrated Moving Average (ARIMA) and Artificial Neural Network (ANN) methodologies. Zafar et al. (2021) devised a hybrid ARIMA-ANN model that effectively leveraged the advantages inherent in both methodologies. This integration significantly enhanced the predictive precision of gold prices in pakistan [21].
The current study investigates regional projections within Pakistan, while the predominant focus of studies is on national-level predictions. Yousaf et al. (2020) employed the autoregressive integrated moving average (ARIMA) model to predict the incidence of COVID-19 cases in Sindh, a province within the country of Pakistan. This emphasizes the importance of designing interventions customized to a specific geographical area [41].
In addition to basic case counts, numerous studies have developed predictive models incorporating additional variables, including temperature and rainfall patterns and socio-economic and other indices. In their study, Arshad et al. (2023) employed artificial neural networks (ANN) to incorporate weather data into predicting COVID-19 outcomes in Pakistan. During this investigation, a significant correlation between temperature and the number of cases was identified [23].
However, machine learning-based predictions are not without challenges. Tariq et al. (2020) have identified several challenges that hinder the attainment of consistently precise estimates. These challenges encompass data quality, model overfitting, and the dynamic nature of the pandemic.
The models’ ability to make accurate predictions holds considerable implications for public health policy. As Lahiri et al. (2021) state, precise and timely forecasts can support policymakers in resource allocation, lockdown measures, and vaccine campaigns [25]. Logistic Regression, Random Forest, Support Vector Machine, and Decision Trees as supervised machine learning models for Fraud Detection in Credit Cards [22]. These models have demonstrated favorable outcomes across various domains, underscoring their adaptability and efficacy in addressing intricate issues. The same methods can also be employed to predict COVID-19 cases in Pakistan.
Although this study focuses on Pakistan, it is noteworthy to highlight that the utilization of ARIMA and ANN for COVID-19 predictions has been extensively documented worldwide. Several studies undertaken in other countries, including India, Brazil, and the United States of America, have provided evidence of the effectiveness of these models, suggesting their universal applicability [26-28].
In summary, the utilization of machine learning techniques, specifically ARIMA and ANN, has exhibited considerable potential in predicting the trajectory of COVID-19 in Pakistan. Despite the challenges encountered, the continuous advancement and refinement of these models, coupled with the incorporation of novel external variables, provide grounds for optimism regarding the potential for enhanced accuracy and timeliness of future forecasts. Utilizing these methodologies offers valuable insights into the advancement of the ailment and furnishes crucial information for the decision-making procedures about public health.
Research Methodology
Dataset Description
The dataset included in this academic publication encompasses the daily cumulative total of confirmed reported cases, fatalities, and recovered spanning from February 26 in 2020 to March 1, 2023 [29, 32]. The model deployment was completed on March 1, 2023, and further forecasting was conducted for one month, from March 1, 2023, to March 30, 2023 [29]. The data was acquired from authoritative publications issued by the National Institute of Health (NIH) in Islamabad, Pakistan [29]. The National Institutes of Health (NIH) is an independent health research organization under the jurisdiction of the Ministry of National Health Services in Pakistan. Its primary responsibilities include conducting biomedical and health-related research and manufacturing vaccines [6, 29]. The National Institute of Health (NIH) in Pakistan has been consistently gathering and disseminating daily reports on COVID-19 since the initial detection of the first case in the country [29]. The data that is currently accessible includes the collective tally of confirmed COVID-19 cases, fatalities, and cures in Pakistan [29].
wt = ∅1wt-1 + ∅2wt-2 + … + ∅p wt-p + α1– θ1 αt-1 – θ2 αt-2 – … – θq αt-q … (1)
This study employs data on confirmed cases, deaths, and recoveries supplied by the National Institutes of Health (NIH). Hence, it is unnecessary to obtain ethical permission for the present inquiry [29]. The global impact of the COVID-19 pandemic has been observed in nearly all countries around the globe. As of March 1, 2023, global records indicate that there have been 758 million documented cases of sickness and 6.8 million deaths [29, 33]. The effects of the COVID-19 pandemic exhibit variation among nations in terms of the reported cases and fatalities [6, 29]. Like previous pandemics, the effective containment and mitigation of COVID-19 necessitates implementing spatial management strategies [6]. The researchers utilized internet databases, assuming their accuracy [30]. Nevertheless, it is essential to note that different countries adhere to their own distinct pandemic reporting and evaluation processes, which may result in the presence of inaccuracies in the data of certain countries [30]. This study presents the inaugural statistical modeling of future monthly COVID-19 cases in Pakistan [29].
Statistical model for Time series (ARIMA Method)
Time-series projection plays a crucial role in epidemiology due to its ability to anticipate the trajectory of infectious diseases. The Box-Jenkins technique, the ARIMA model, is a commonly employed tool for analyzing and predicting univariate time series data. The methodology examines the observational data collected at pre-established temporal intervals [37]. The application of a dependable tool facilitates the examination of stationary time series data. The ARIMA statistical model combines the Autoregressive (AR) and Moving Average (MA) procedures, as represented in Fig. 1 It is used to analyze the association between the present value of a time series and its preceding values, as well as the connection between the current forecast error and the prior forecast mistakes. The user did not provide any text to rewrite. In its general form, the ARIMA(p,d,q) model can be mathematically written as an equation.
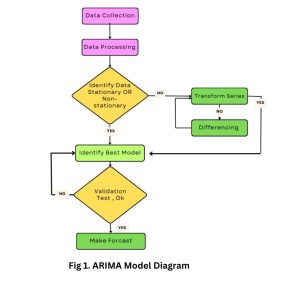
Fig. 1: ARIMA Model Architecture Diagram
Where wt is the differenced time series (if needed), Φ1, Φ2,…., Φp are the autoregressive parameters, it is the residual/forecast error, and Θ1, Θ2,…., Θq are the moving average parameters.
The parameter d represents the number of differencing operations required to transform the raw observations into a stationary series. If the differencing of order one (d=1) for non-seasonal data leads to a stationary process, it can be concluded that the differencing operator is effective.
∇Xt = Wt = Xt – Xt-1 … … [39] (2)
∇= difference operator,
d= degree of difference,
{wt}= differenced series.
To address the exponential growth exhibited in COVID-19 case data, the cumulative case numbers were utilized for modeling and forecasting purposes by implementing ARIMA.
Selecting an appropriate ARIMA model entails ascertaining the optimal values for the parameters p, d, and q, which yield a stationary residual series that exhibits white noise characteristics. The examination of the Autocorrelation Function (ACF) and Partial Autocorrelation Function (PACF) plots of the differenced time series was conducted [37].
The autocorrelation function (ACF), which highlights the relationship between the residual and its lagged values, is a valuable tool for estimating the autoregressive parameters (p). The Partial Autocorrelation Function (PACF) is a statistical tool used to determine the Moving Average (MA) parameters (q) in a time series model. It achieves this by measuring the correlation between the residual and the lagged forecast errors after accounting for the influence of intervening residuals.
The estimation of potential ARIMA models was conducted using the maximum likelihood technique, with the determination of these models based on an examination of the Autocorrelation Function (ACF) and the Partial Autocorrelation Function (PACF). The model that provided the best fit was chosen by considering the minimum values of the Akaike Information Criterion (AIC) and Bayesian Information Criterion (BIC), which take into account both the simplicity of the model and its goodness of fit [35]. The fitted ARIMA model was utilized to produce projections for many time steps in advance, extending up to four weeks. The evaluation of forecasting accuracy was conducted by employing three commonly used metrics: Mean Absolute Percentage Error (MAPE), Mean Absolute Error (MAE), and Root Mean Squared Error (RMSE). Lower values of these indicators represent a more favorable forecasting performance. The data processing, modeling, forecasting, and analysis procedures utilized the Python libraries for forecasting, statistics, time series, and machine learning [38].
ANN Model
The multilayer perceptron, also called MLP, is a feedforward neural network frequently employed in artificial neural network (ANN) architectures for predicting COVID-19 scenarios. The user’s text does not contain any information to rewrite. A multilayer Perceptron, sometimes called an MLP, typically comprises a solitary input layer, an output layer, and one or more hidden layers. The input layer is responsible for supplying data to the neural network, while the output layer is responsible for generating forecasted information. The hidden layer facilitates the establishment of nonlinear connections between the inputs and outputs through the adjustment of weights, a process commonly referred to as learning. The layers are comprised of varying quantities of neurons, which undertake the processing of data through the utilization of activation functions [41].
The suitability of the MLP architecture for COVID-19 case prediction arises from its ability to effectively process extensive datasets and learn from them without prior knowledge of the model’s functional form or nonlinear structure [40]. The Multilayer Perceptron (MLP) architecture is a data-driven approach employed when there is a need for more theoretical knowledge regarding the underlying model. Fig. 2 illustrates the overall structure of the multilayer Perceptron (MLP).
The training of the MLP architecture involves the utilization of a training algorithm. One commonly employed training technique for nonlinear least squares is the Broyden–Fletcher–Goldfarb–Shanno (BFGS) algorithm[40]. The authors propose an enhancement to the backpropagation method by integrating it with the BFGS algorithm, aiming to enhance the efficiency of the training process [40]. The utilization of the validation set (40) enables the fine-tuning of the hyperparameters of the Multilayer Perceptron (MLP) model.
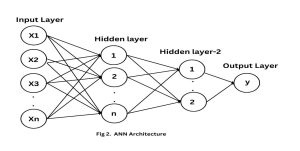
Fig. 2: ANN Architecture Diagram
The hyperparameters encompass various factors, such as the number of hidden layers, the number of neurons contained within each hidden layer, and the choice of activation function employed by the neurons. The evaluation of the MLP architecture is conducted on the testing set, with the performance measurements comprising mean square error (MSE) and mean absolute error (MAE) [40]. The predictions undergo a post-processing procedure to normalize the magnitude of verified cases and deaths. This is achieved by adjusting the values based on pre-existing references kept for this purpose [40].
Fig.2, depicts the Multilayer Perceptron (MLP) architecture, demonstrating its appropriateness as a model for an Artificial Neural Network (ANN) in predicting COVID-19 scenarios. The Multilayer Perceptron (MLP) architecture consists of an input layer, an output layer, and one or more hidden layers. Arthur Samuel invented the Multilayer Perceptron (M LP). The Multilayer Perceptron (MLP) architecture is taught through a training method, while the validation set fine-tunes the hyper-parameters. The MLP architecture’s performance is evaluated using the testing set. Subsequently, the predictions are subjected to post-processing to modify the scale of verified cases and deaths. For normalization, this adjustment makes use of previously stored data.
Results & Discussion
Results of the ARIMA Model
To further elaborate on the research methods and findings, we will conduct a more comprehensive analysis of the ARIMA model and its implementation within our study.
Fig. 4, shows the trend of daily confirmed cases, daily fatalities, and daily recovered cases over time. The Auto-Regressive Integrated Moving Average (ARIMA) model is a widely utilized forecasting tool in time series research. The present study employed this model to predict the daily tally of verified COVID-19 confirmed cases, daily fatalities, and daily recovered cases over time, as shown in Fig . 4-6, for the next 30 days.
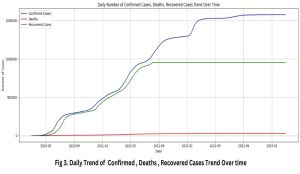
Fig. 3: Daily Trend of confirmed, Deaths, Recovered Cases
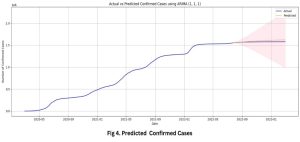
Fig. 4: Graph showing Predicted Confirmed Cases using ARIMA Model
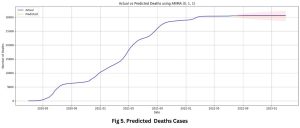
Fig. 5: Graph showing Predicted Deaths Cases using ARIMA Model
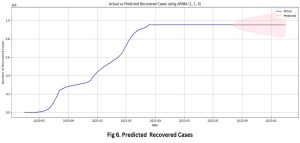
Fig. 6: Graph showing Predicted Recovered Cases using ARIMA Model
However, the ARIMA model’s limitation is that it cannot simultaneously produce models for multiple outcomes. Due to this constraint, it was necessary to develop three separate ARIMA models, each specifically designed for one variable: daily confirmed cases, Deaths, and recoveries. The models were constructed using the Stats models packages in Python, renowned for their robust capabilities in statistical computations.
The initial step in utilizing the ARIMA model is to evaluate the stationarity of the time series under consideration. The concept of stationarity refers to a situation in which the statistical properties of a time series, produced by a particular process, stay consistent over the whole duration of the time series. The assumption of stationarity holds great importance in various statistical models as it allows for applying a wide range of techniques that would otherwise be inapplicable to non-stationary series. However, as depicted in Fig. 7, the data initially required adherence to these requirements. To conduct a more comprehensive examination of the daily infection case count, the Autocorrelation Function (ACF) graph was employed, as depicted in Fig. 8, The autocorrelation function (ACF) plot exhibited a sequential pattern in the daily count of confirmed cases. Serial trends, often called serial correlation or autocorrelation, pertain to a relationship between a variable and its values across consecutive periods within a time series. Identifying a sequential pattern within our dataset required implementing a preprocessing technique known as differencing.
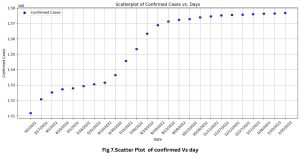
Fig. 7: Scatter Plot of Confirmed Cases Vs Day
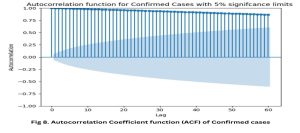
Fig. 8: Auto correlation Coefficient Function of Confirmed Cases
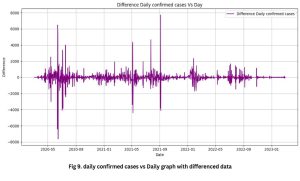
Fig. 9: Daily Confirmed Cases Vs Daily Differenced Data
Differencing is a method of statistical analysis applied to convert a time series that exhibits non-stationarity into a stationary time series. The process entails the computation of the disparity between successive observations. The time series that has been differenced, as depicted in Fig. 9, has met the requirement for stationarity, enabling us to proceed with the ARIMA modeling.
Carefully selecting values for the p, q, and d variables is crucial in constructing an ARIMA model that can yield accurate outcomes. The variable ‘p’ represents the autoregressive component’s order, the variable ‘d’ represents the degree of initial differencing applied, and the variable ‘q’ represents the moving average component’s order. The parameters as mentioned above exert a substantial influence on the efficacy of the model. Hence, this study involved conducting experiments with various combinations of p, q, and d variables to construct ARIMA models and assess their performance.
Fig. 10 and 11 illustrate the Autocorrelation Function (ACF) and Partial Autocorrelation Coefficient Function (PACF) graphs, respectively. These plots were employed to ascertain the optimal ARIMA model. These graphs are imperative in analyzing time series as they serve as indispensable instruments for visually assessing the autocorrelation present within the data. The findings of our analysis indicate a significant presence of autocorrelation, a prevalent attribute observed in time series data about epidemics.
A thorough examination has determined that the ARIMA model with parameters (1, 1, 0) has demonstrated superior efficacy in forecasting the daily count of infection cases. The statistical analysis revealed that the p-value for the daily infection count was 0.000, with a significance level set at 5%. The obtained outcome provides compelling evidence contradicting the null hypothesis, indicating a statistically significant link. The methodology mentioned above was utilized to predict the daily figures for both mortality and recovery. The findings yielded valuable insights. The insights they offered possess significant value regarding their capacity to inform and direct public health initiatives and strategies.
The results are displayed in Table 1, which provides the Pearson correlation coefficient (R), sum of squared errors (SSE), mean squared error (MSE), and p-values for all estimated parameters. The Pearson correlation coefficient is a statistical metric employed to quantify the degree and direction of the linear relationship between two variables.
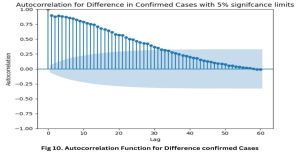
Fig. 10: Autocorrelation Function for Difference Confirmed Cases
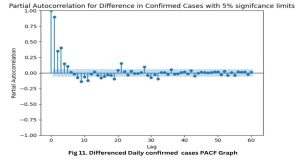
Fig. 11: Differenced Daily Confirmed PACF Graph
The findings in Table 1 indicate that the daily recovery count demonstrates the most substantial level of correlation. The strong correlation in this context signifies a resilient linear association essential in developing forecasting models.
Additionally, an analysis was conducted on the SSE and MSE values. The following measures are frequently employed to assess the precision of estimations or predictions. The researchers quantify the discrepancy between the observed values and the estimated values. Based on the criteria utilized, it can be inferred that the daily death estimate showed the lowest degree of inaccuracies, indicating that our model achieved the highest level of accuracy in forecasting daily deaths.
Our research showcases the practicality and efficacy of employing the ARIMA model to predict the daily figures about COVID-19 cases of confirmed, death, and recovered cases. Notwithstanding its limitations, this research provides significant insights that have the potential to inform and shape future public health initiatives and actions.
Result of ANN
The current study utilized a dataset comprising 1066 consecutive days to assess the forecasting effectiveness of Artificial Neural Networks (ANN) in the context of the COVID-19 pandemic. The sample size, both in terms of its breadth and depth, plays a pivotal role in assessing the efficacy of an artificial neural network (ANN) model. These parameters directly impact the model’s ability to produce outputs that can be generalized. Historically, artificial neural networks (ANNs) that underwent training on limited datasets tended to converge towards local minima, reducing their ability to generalize well. To address these problems, we employed a strategic approach to divide our dataset into three distinct parts. Specifically, we allocated 70% of the total 746 samples for training purposes, while 15% of the 160 samples were put aside for testing, and another 15% of the 160 samples were allocated for validation. Implementing this split facilitated the careful evaluation of the generalization power of our neural networks. To enhance the reliability of our methodology, we conducted training for each network for 200 iterations. We implemented a stopping condition whereby the training process was terminated if the change in error reached a threshold of 0.0000001. In addition, 500 distinct network configurations were tested to enhance performance.
Table I: ARIMA Model Parameters& Results.
| ARIMA (p,d,q) | R | SSE | MSE | p-Value | |
| Confirmed Cases | ARIMA (1,1,1) | 0.9999 | 613,801,367.5822 | 560,549.1941 | 0.000 |
| deaths | ARIMA (0,1,1) | 0.9999 | 1,226,318.3107 | 1,119.9253 | 0.000 |
| Recoveries | ARIMA (1,1,0) | 0.9999 | 2,200,854,636.0182 | 2,009,912.9096 | 0.000 |
Table II: Best ANN Model Network Architecture
| Training perf. | Testing perf. | Validation perf. | Training algorithm | Error function | Hidden activation | Output activation | |
| MLP 5-10-3 | 0.98 | 0.98 | 0.98 | BFGS | SSE | Hyperbolic tangent | Logistic |
Table III: Best ANN Model Network Architecture
| Training error | Testing error | Validation error | |
| SSE | 112,734,514.20 | 18,183,933.28 | 21,255,295.41 |
| MSE | 323,021.53 | 242,452.44 | 283,403.94 |
Table IV: Pearson correlation values of parameters
| R values of MLP 5-10-3 | Train | Test | Validation |
| Daily number of infected cases | 0.9995 | 0.9997 | 0.9996 |
| Daily number of deaths | 0.9998 | 0.9998 | 0.9998 |
| Daily number of recovered cases | 0.99997 | 0.99998 | 0.99998 |
In the proposed model architecture, the following variables were identified as inputs:
- Daily infected cases
- Daily Deaths cases
- Daily recoveries
As a result, the outputs of our model were designed to make predictions regarding:
- Confirmed cases
- Deaths
- Recoveries Cases
To enhance the validity of our model, we analyzed the statistical significance of our input parameters by evaluating their respective p-values. The results of our study indicated that the p-values for Confirmed cases, Deaths, and recovered cases were all 0.000. This observation indicates that all the input parameters used in our artificial neural network (ANN) model are statistically significant, as evidenced by the p-values being well below the threshold of 0.05.
To gain a comprehensive understanding of the patterns and trends of the pandemic in Pakistan, we conducted a daily calculation of the number of individuals susceptible to the virus, starting from when the first case of recovery was reported. The calculation mentioned above was accomplished using the following formula:
Susceptible = Population – Deaths – Recovered cases.
During the COVID-19 pandemic, Pakistan experienced the implementation of diverse non-pharmaceutical measures, such as the closure of educational institutions, restrictions on travel, curfews, and the enforcement of quarantines. Implementing and adhering to curfews at different stages of the pandemic exhibited significant variability, exerting a crucial impact on the fluctuation of daily COVID-19 case counts.
The presence of multicollinearity among the independent variables, which is a critical assumption in regression-based methodologies, was thoroughly examined in our research. The variance inflation factor (VIF) was utilized as a diagnostic tool to identify the presence of multicollinearity. The variables in our study exhibited VIF values within the range of 1-2, indicating that multicollinearity was not observed as a significant issue. The artificial neural network (ANN) studies utilized state-of-the-art machine-learning packages in Python.
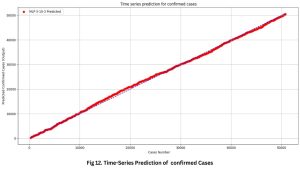
Fig. 12: Graph showing Time-Series Prediction of Confirmed Cases ANN Model
The effectiveness of our model is emphasized by the Pearson Correlation coefficients, as presented in Table 4. The model’s ability to accurately anticipate the trajectory of COVID-19 in Pakistan is shown by the significant correlation values observed between the daily counts of fatalities, recoveries, and infections. This indicates the resilience and reliability of the model.
Based on the data shown in Table 1, it is evident that the multilayer perceptron model exhibits greater performance in comparison to alternative network topologies. Due to curfews’ discrete and distinct nature, this model considers them as two distinct input neurons among five. The model consists of 10 hidden neurons and three output neurons. The Broyden-Fletcher-Goldfarb-Shanno (BFGS) algorithm was employed for training. The selection of activation functions for the hidden and output layers, such as the hyperbolic tangent and logistic functions, was carefully considered. Tables 3 and 4 show that the selected network can generate precise forecasts about daily infection, fatality, and recovery rates.
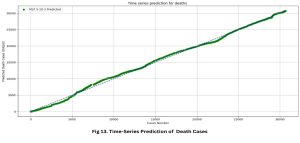
Fig. 13: Graph showing Time-Series Prediction of Death Cases ANN Model
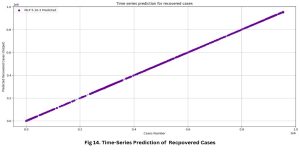
Fig. 14: Graph showing Time-Series Prediction of Recovered Cases ANN Model
A high correlation coefficient may suggest either inadequate generalization by the network or the existence of a linear link between the variables. Nevertheless, the graphical representations in Fig. 12 to 14 exhibit a strong correlation between the projected and observed output curves, so indicating the proficiency of our model in nonlinear estimations. To establish the precision and effectiveness of our Artificial Neural Network (ANN) model within the framework of the COVID-19 pandemic, we give visual illustrations that portray the time series forecasts for our three outcomes.
Conclusion
This comprehensive investigation analyzes ARIMA and MLP 5-10-3 ANN models to predict the number of COVID-19 confirmed cases, fatalities, and recoveries in Pakistan from March 1 to March 30, 2023. The research was motivated by the requirement for precise and dependable prediction insights, crucial for healthcare systems and policymakers to develop robust strategies and optimize resource allocation during epidemics. The linear and time-dependent ARIMA models exhibited high precision, with R-values approaching 0.9999 and statistically insignificant p-values. However, different error metrics suggest further enhancements, particularly in recovery prediction. Based on the MLP architecture, the ANN model effectively captured intricate and nonlinear relationships among pandemic data. Its high-performance metrics and Pearson correlation coefficients indicate the potential of nonlinear models to comprehend pandemic dynamics. The comparison of ARIMA and ANN models demonstrated the advantageous combination of linear and nonlinear modeling approaches, highlighting their synergy and complementarity. Integrating ARIMA’s interpretability and simplicity with ANN’s relational modeling capabilities can lead to more nuanced, robust, and dependable outcomes. However, a thorough investigation of overfitting is necessary to ensure the accuracy and performance of both models using novel and developing data. This ensures their adaptability, resilience, and value in the dynamic context of the ongoing pandemic. This study contributes to advancing public health research in Pakistan by utilizing machine learning techniques, underscoring the significance of predictive modeling in health emergency policy and intervention. It highlights the need to continuously explore various modeling approaches to effectively respond to the COVID-19 pandemic and proactively address forthcoming public health crises. To enhance forecasting models’ efficacy, incorporating novel criteria and real-time data updates, including vaccination information, is crucial. Integrating dynamic data points can improve accuracy and dependability, facilitating Pakistan’s efforts to mitigate COVID-19’s incidence and impact.
The study’s findings have unveiled significant progress and valuable insights in predictive modeling for COVID-19, facilitating further research and addressing knowledge gaps. To enhance models’ dependability and predictive potential, incorporating genetic data and socioeconomic factors to a greater extent is imperative. Sophisticated machine learning and statistical techniques, such as ensemble and deep learning models, are essential for comprehending the pandemic’s multifaceted dimensions. Promoting responsible and fair utilization of these models in public health requires a comprehensive examination of their ethical implications and interpretability. Their practicality and efficacy in influencing policy and public health measures necessitate comprehensively evaluating their real-world impacts. We can enhance our collective strategy and resilience in effectively managing public health crises by addressing research gaps, enhancing and integrating models, and investigating advanced approaches. These efforts will contribute to the expanding knowledge base in combatting COVID-19 and potential future pandemics. As a researcher, I propose future research directions to enhance the effectiveness of predictive modeling for COVID-19 and other public health emergencies.
To improve model accuracy, integrate more extensive and up-to-date data, including demographic information, regional health statistics, and mobility patterns. Explore real-time data sources to capture individual-level health and exposure data. Examine the inclusion of additional predictive variables, such as weather conditions, air quality, and social distancing measures, to enhance model performance. Develop and evaluate hybrid models that combine the strengths of ARIMA and ANN. Conduct comparative studies with other predictive models to identify the most suitable approach for different scenarios. Explore customized approaches for implementing policies based on model forecasts, considering regional variations and resource constraints. Explore using predictive models to optimize resource allocation, including healthcare personnel, medical supplies, and testing capacity. Evaluate the impact of predictive models on public health decision-making and policy outcomes. Foster collaborations among data scientists, public health experts, and policymakers to develop comprehensive pandemic control plans. Integrate knowledge from social sciences to understand and address human factors influencing pandemic dynamics. Examine the scalability of the developed models to broader geographical contexts, including countries with diverse healthcare systems and resource levels. Investigate the generalizability of model findings across different regions and populations. Examine the ethical and social implications of using predictive models in public health, including data privacy, public trust, and algorithmic bias. Develop guidelines and best practices for the responsible and transparent use of predictive models in pandemic management. By addressing these future research directions, we can enhance the effectiveness of predictive modeling for COVID-19 and other public health emergencies, contributing to more effective and efficient pandemic management strategies.
Author Statement: J.S, The principal author of this research paper has contributed massively to complete this research. Furthermore, J. B (Ph.D.), H.A.R, and M.K are the research coauthors and offered technical support for finalizing the research.
Funding: No specific funding or financial support was given to the authors for this study.
Conflict of interest: No conflict of interest.
Ethical Approval: Not Required
REFERENCES
[1] H. Zhu, L. Wei, and P. Niu, “The novel coronavirus outbreak in Wuhan, China,” Glob Health Res Policy, vol. 5, p. 6, 2020, doi: 10.1186/s41256-020-00135-6.
[2] Y. C. Wu, C. S. Chen, and Y. J. Chan, “The outbreak of COVID-19: An overview,” J Chin Med Assoc, vol. 83, no. 3, pp. 217-220, Mar 2020, doi: 10.1097/JCMA.0000000000000270.
[3] T. Singhal, “A Review of Coronavirus Disease-2019 (COVID-19),” Indian J Pediatr, vol. 87, no. 4, pp. 281-286, Apr 2020, doi: 10.1007/s12098-020-03263-6.
[4] “WHO Coronavirus Disease (COVID-19) Dashboard,” in Bangladesh Physiotherapy Journal, vol.10 ed, 2020.
[5] S. Ahmad, D. E. Lucero-Prisno, 3rd, M. Y. Essar, H. Khan, and A. Ahmadi, “Pakistan and COVID-19: The mystery of the flattened curve,” J Glob Health, vol. 11, p. 03013, Jan 11 2021, doi: 10.7189/jogh.11.03013.
[6] S. Kotcharin, S. Maneenop, and A. Jaroenjitrkam, “The impact of government policy responses on airline stock return during the COVID-19 crisis,” Research in Transportation Economics, vol. 99, p. 101298, 2023/06/01/ 2023, doi: https://doi.org/10.1016/j.retrec.2023.101298.
[7] R. Rasheed, A. Rizwan, H. Javed, F. Sharif, and A. Zaidi, “Socio-economic and environmental impacts of COVID-19 pandemic in Pakistan-an integrated analysis,” Environ Sci Pollut Res Int, vol. 28, no. 16, pp. 19926-19943, Apr 2021, doi: 10.1007/s11356-020-12070-7.
[8] H. Baalbaki et al., “Fighting against COVID-19: Who Failed and Who Succeeded?,” Journal of Computer and Communications, vol. 10, no. 04, pp. 32-50, 2022, doi: 10.4236/jcc.2022.104004.
[9] H. A.-O. X. Akhtar et al., “Pakistan’s Response to COVID-19: Overcoming National and International Hypes to Fight the Pandemic,” (in eng), no. 2369-2960 (Electronic).
[10] O. Delardas, K. Kechagias, P. Pontikos, and P. Giannos, “Socio-Economic Impacts and Challenges of the Coronavirus Pandemic (COVID-19): An Updated Review,” Sustainability, vol. 14, 08/06 2022, doi: 10.3390/su14159699.
[11] K. A. Majeed, Z. Abbas, M. Bakhtyar, J. Baber, I. Ullah, and A. Ahmed, “Face Detectors Evaluation to Select the Fastest among DLIB, HAAR Cascade, and MTCNN,” Pakistan Journal of Emerging Science and Technologies (PJEST), vol. 2, no. 1, pp. 50-62, 07/10 2021, doi: 10.58619/pjest.v2i1.135.
[12] H. Jawed, “Pandemic Coronavirus COVID-19 Spread in Pakistan in 2020: Jawed H. Pandemic Coronavirus COVID-19 Spread in Pakistan in 2020,” Journal of Respiratory Research, vol. 6, pp. 148-151, 01/01 2020, doi: 10.17554/j.issn.2412-2424.2019.06.50.
[13] N. Ilyas, R. Azuine, and A. Tamiz, “COVID-19 Pandemic in Pakistan,” International Journal of Translational Medical Research and Public Health, vol. 4, pp. 37-49, 05/08 2020, doi: 10.21106/ijtmrph.139.
[14] H. Jawed, “Pandemic Coronavirus COVID-19 Spread in Pakistan in 2020,” 2020.
[15] F. M. Khan and R. Gupta, “ARIMA and NAR based prediction model for time series analysis of COVID-19 cases in India,” Journal of Safety Science and Resilience, vol. 1, no. 1, pp. 12-18, 2020/09/01/ 2020, doi: https://doi.org/10.1016/j.jnlssr.2020.06.007.
[16] S. Ahmed, S. Khan, and I. Hussain, “Impact of Government Interventions on COVID-19 Outbreak in Different Provinces of Pakistan: Interrupted Time-Series Analysis,” SSRN Electronic Journal, 01/01 2020, doi: 10.2139/ssrn.3688215.
[17] R. G M Al-Allaff, S. M Y Al-Taee, and S. T D Baker, “Some Immunological Impacts of Face Mask Usage During the COVID-19 Pandemic,” Pakistan journal of biological sciences : PJBS, vol. 24 9, pp. 920-927, 2021.
[18] A. Roy, “Forecasting COVID-19 Transmission in India Using Deep Learning Models,” Letters in Applied NanoBioScience, vol. 10, 10/18 2020, doi: 10.33263/LIANBS102.20442055.
[19] A. Kożuch, D. Cywicka, and K. Adamowicz, “A Comparison of Artificial Neural Network and Time Series Models for Timber Price Forecasting,” Forests, vol. 14, no. 2, doi: 10.3390/f14020177.
[20] H. R. Niazkar and M. Niazkar, “Application of artificial neural networks to predict the COVID-19 outbreak,” Global Health Research and Policy, vol. 5, no. 1, p. 50, 2020/11/23 2020, doi: 10.1186/s41256-020-00175-y.
[21] F. Khan, A. Urooj, and S. Muhammadullah, “AN ARIMA-ANN HYBRID MODEL FOR MONTHLY GOLD PRICE FORECASTING: EMPIRICAL EVIDENCE FROM PAKISTAN,” pp. 61-75, 01/01 2021.
[22] A. U. Aftab, I. Shahzad, M. Anwar, A. Sajid, and N. Anwar, “Fraud Detection of Credit Cards Using Supervised Machine Learning,” Pakistan Journal of Emerging Science and Technologies (PJEST), vol. 4, no. 3, pp. 1-14, 06/28 2023, doi: 10.58619/pjest.v4i3.114.
[23] S. Arshad, J. H. Kazmi, M. G. Javed, and S. Mohammed, “Applicability of machine learning techniques in predicting wheat yield based on remote sensing and climate data in Pakistan, South Asia,” European Journal of Agronomy, vol. 147, p. 126837, 2023/07/01/ 2023, doi: https://doi.org/10.1016/j.eja.2023.126837.
[24] S. G. Paul et al., “Combating Covid-19 using machine learning and deep learning: Applications, challenges, and future perspectives,” Array (N Y), vol. 17, p. 100271, Mar 2023, doi: 10.1016/j.array.2022.100271.
[25] A. Lahiri and S. S. Jha, “Machine Learning to Deep Learning: Artificially Intelligent Approaches Toward Precision in Public Health,” Journal of Public Health and Primary Care, vol. 2, no. 2, 2021. [Online]. Available: https://journals.lww.com/jphp/fulltext/2021/02020/machine_learning_to_deep_learning__artificially.1.aspx.
[26] I. Khandelwal, R. Adhikari, and G. Verma, “Time Series Forecasting Using Hybrid ARIMA and ANN Models Based on DWT Decomposition,” Procedia Computer Science, vol. 48, pp. 173-179, 2015/01/01/ 2015, doi: https://doi.org/10.1016/j.procs.2015.04.167.
[27] S. C, M. K.G, N. G, and P. M. J, “Dynamic Analytics and Forecasting Model for Covid-19 Using Machine Learning Algorithms,” Webology, 2021.
[28] S. M. I. Osman and A. Sabit, “Predictors of COVID-19 vaccination rate in USA: A machine learning approach,” Mach Learn Appl, vol. 10, p. 100408, Dec 15 2022, doi: 10.1016/j.mlwa.2022.100408.
[29] N. Pakistan, “National Institutes of Health (NIH) Pakistan,” ed. Pakistan: National Institutes of Health (NIH), 2023.
[30] M. Shakhnazarova, “True death toll of COVID-19 in Georgia: estimates of the number of deaths from COVID-19,” European Journal of Public Health, vol. 32, no. Supplement_3, p. ckac131.062, 2022, doi: 10.1093/eurpub/ckac131.062.
[31] M. Z. Abbas, J. Baber, M. Bakhtyar, Ihsanullah, and W. Noor, “Evaluation of Face Detectors for Face Recognition,” Pakistan Journal of Emerging Science and Technologies (PJEST), vol. 3, no. 2, pp. 1-10, 01/20 2023, doi: 10.58619/pjest.v3i2.77.
[32] D. Malouche. “a Real-Time COVID-19 Tracker.” www.Covidradar24.org (accessed Jan,2021.
[33] “HPRA safety update on COVID-19 vaccines up to January 2023,” Reactions Weekly, vol. 1946, no. 1, pp. 2-2, 2023/03/01 2023, doi: 10.1007/s40278-023-34603-2.
[34] M. Miller, “2019 Novel Coronavirus COVID-19 (2019-nCoV) Data Repository,” Bulletin – Association of Canadian Map Libraries and Archives (ACMLA), pp. 47-51, 03/30 2020, doi: 10.15353/acmla.n164.1730.
[35] E. Parzen, “Some recent advances in time series modeling,” IEEE Transactions on Automatic Control, vol. 19, no. 6, pp. 723-730, 1974, doi: 10.1109/TAC.1974.1100733.
[36] G. E. P. a. J. Box, G.M., Time Series Analysis Forecasting and Control. ,, Revised Edition ed. ( Holden Day). San Francisco: Scientific Research Publishing., 1976.
[37] G. Tunnicliffe Wilson, “Time Series Analysis: Forecasting and Control,5th Edition, by George E. P. Box, Gwilym M. Jenkins, Gregory C. Reinsel and Greta M. Ljung, 2015. Published by John Wiley and Sons Inc., Hoboken, New Jersey, pp. 712. ISBN: 978-1-118-67502-1,” Journal of Time Series Analysis, vol. 37, pp. n/a-n/a, 03/01 2016, doi: 10.1111/jtsa.12194.
[38] R. J. Hyndman and Y. Khandakar, “Automatic Time Series Forecasting: The forecast Package for R,” Journal of Statistical Software, vol. 27, no. 3, pp. 1 – 22, 07/29 2008, doi: 10.18637/jss.v027.i03.
[39] K. Mehmood et al., “The impact of COVID-19 pandemic on air pollution: a global research framework, challenges, and future perspectives,” Environmental Science and Pollution Research, vol. 29, no. 35, pp. 52618-52634, 2022/07/01 2022, doi: 10.1007/s11356-022-19484-5.
[40] N. M. Nawi, M. R. Ransing, and R. S. Ransing, “An Improved Learning Algorithm Based on The Broyden-Fletcher-Goldfarb-Shanno (BFGS) Method For Back Propagation Neural Networks,” in Sixth International Conference on Intelligent Systems Design and Applications, 16-18 Oct. 2006 2006, vol. 1, pp. 152-157, doi: 10.1109/ISDA.2006.95.
[41] M. Yaghini, M. M. Khoshraftar, and M. Fallahi, “A hybrid algorithm for artificial neural network training,” Engineering Applications of Artificial Intelligence, vol. 26, no. 1, pp. 293-301, 2013/01/01/ 2013, doi: https://doi.org/10.1016/j.engappai.2012.01.023.
[42] M. Haidari, “Prediction of COVID-19 Cases in Afghanistan Using ARIMA Model,” ed: SSRN, 2021.
[43] H. Akhtar et al., “Pakistan’s Response to COVID-19: Overcoming National and International Hypes to Fight the Pandemic,” JMIR Public Health Surveill, vol. 7, no. 5, p. e28517, May 19 2021, doi: 10.2196/28517.